Technical Analysis of BITF 2024-05-10
Overview:
In analyzing the technical indicators for BITF over the last 5 days, we will delve into the trend, momentum, volatility, and volume indicators to provide a comprehensive outlook on the possible stock price movement in the coming days. By examining these key aspects, we aim to offer valuable insights and predictions to guide investment decisions.
Trend Analysis:
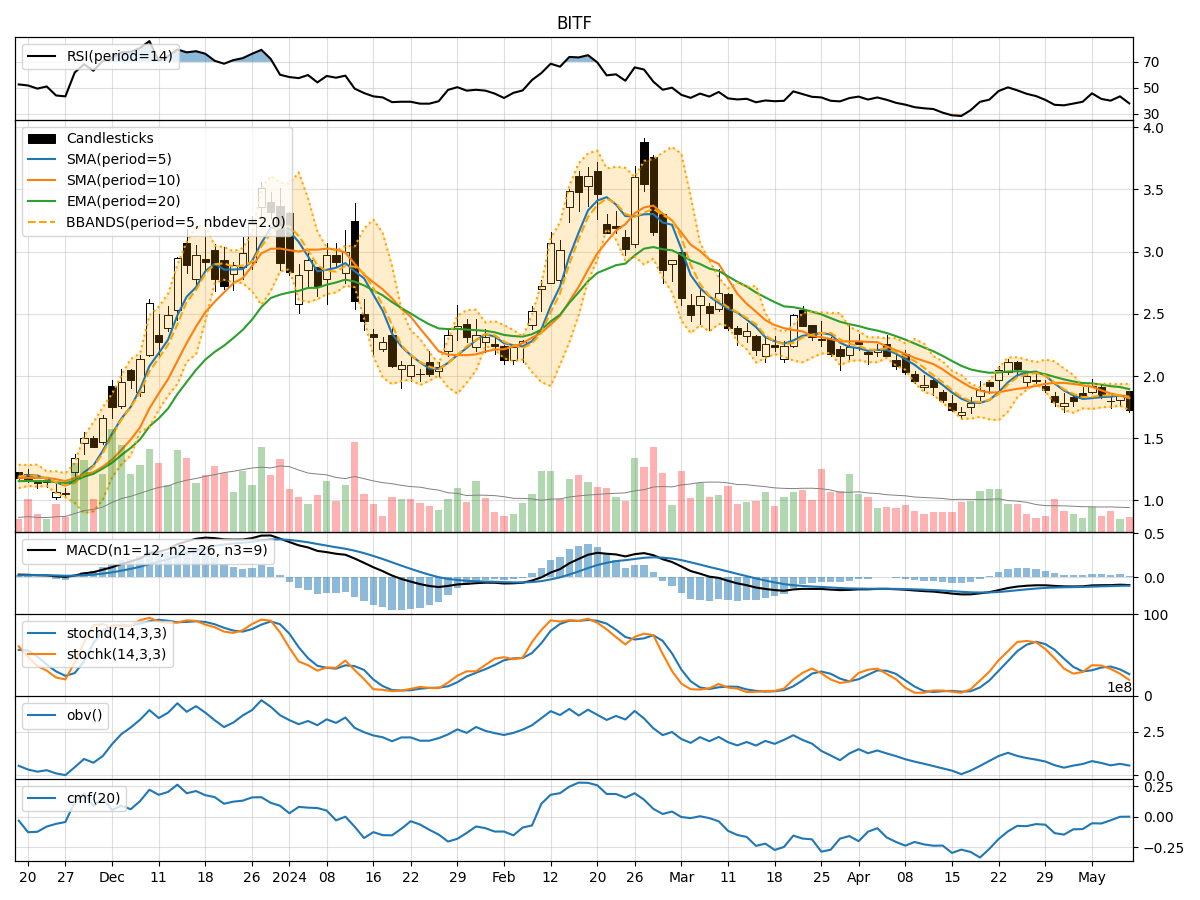
- Moving Averages (MA): The 5-day MA has been consistently below the closing prices, indicating a short-term downtrend.
- MACD: The MACD line has been negative, suggesting bearish momentum in the stock.
- EMA: The EMA has been declining, further supporting the bearish trend.
Momentum Analysis:
- RSI: The RSI has been hovering around the oversold territory, indicating a potential reversal or consolidation.
- Stochastic Oscillator: Both %K and %D have been decreasing, signaling weakening momentum.
- Williams %R: The indicator has been in the oversold region, suggesting a possible bounce back.
Volatility Analysis:
- Bollinger Bands (BB): The stock price has been trading near the lower Bollinger Band, indicating potential oversold conditions.
- BB Width: The bands have been narrowing, suggesting a decrease in volatility.
- BB %B: The %B is low, indicating a possible reversal or consolidation.
Volume Analysis:
- On-Balance Volume (OBV): The OBV has been declining, reflecting selling pressure in the stock.
- Chaikin Money Flow (CMF): The CMF has been negative, indicating outflow of money from the stock.
Key Observations:
- The stock is currently in a downtrend based on moving averages and MACD.
- Momentum indicators suggest a potential reversal or consolidation in the near term.
- Volatility is decreasing, indicating a possible stabilization in price movements.
- Volume indicators reflect selling pressure and a negative money flow.
Conclusion:
Based on the analysis of technical indicators, the stock is likely to experience further downside in the short term. The bearish trend is supported by moving averages and MACD, while momentum indicators hint at a possible reversal or consolidation. Volatility is decreasing, suggesting a stabilization in price movements, but the overall sentiment remains bearish. Traders should exercise caution and consider waiting for clearer signals of a trend reversal before considering long positions.