Technical Analysis of BIOX 2024-05-10
Overview:
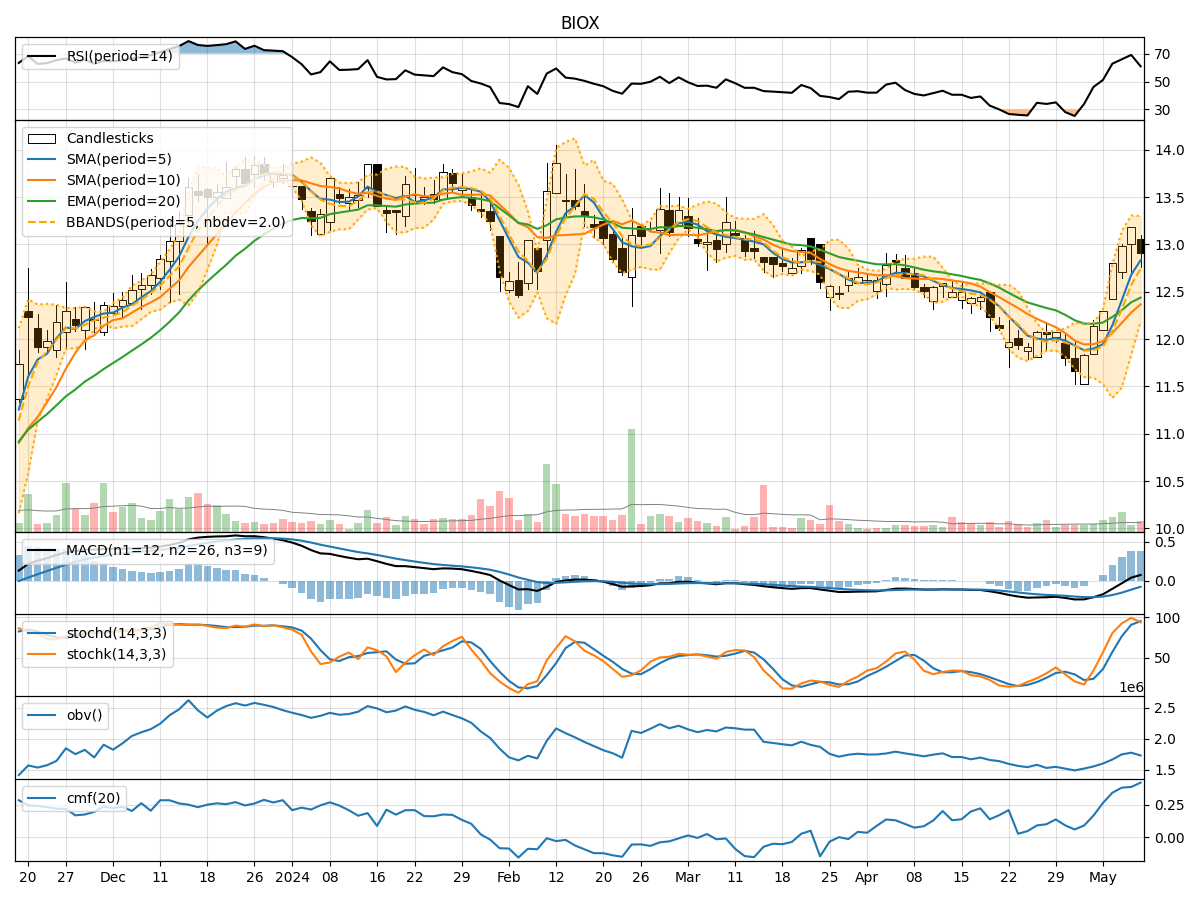
In analyzing the technical indicators for BIOX over the last 5 days, we will delve into the trend, momentum, volatility, and volume indicators to provide a comprehensive outlook on the possible stock price movement in the coming days.
Trend Analysis:
- Moving Averages (MA): The 5-day Moving Average (MA) has been trending upwards, indicating a positive momentum in the stock price.
- MACD: The Moving Average Convergence Divergence (MACD) has been consistently increasing, suggesting a strengthening bullish trend.
- RSI: The Relative Strength Index (RSI) has been fluctuating but generally staying within the neutral range, indicating a balanced market sentiment.
Momentum Analysis:
- Stochastic Oscillator: Both %K and %D values have been in the overbought territory, signaling a potential reversal or consolidation.
- Williams %R: The Williams %R indicator has been fluctuating but recently showed oversold conditions, hinting at a possible buying opportunity.
Volatility Analysis:
- Bollinger Bands: The Bollinger Bands have been narrowing, indicating decreasing volatility and a potential breakout or significant price movement ahead.
Volume Analysis:
- On-Balance Volume (OBV): The OBV has been mostly positive, suggesting accumulation by investors.
- Chaikin Money Flow (CMF): The CMF has been gradually increasing, indicating buying pressure in the stock.
Key Observations:
- The stock has shown a bullish trend based on moving averages and MACD.
- Momentum indicators suggest a potential reversal or consolidation in the short term.
- Volatility is decreasing, hinting at a possible period of consolidation before a breakout.
- Volume indicators point towards positive accumulation and buying pressure.
Conclusion:
Based on the analysis of the technical indicators, the stock is likely to experience a period of consolidation in the near term. However, considering the bullish trend and positive volume indicators, the overall outlook remains bullish. Traders should watch for potential reversal signals from momentum indicators and be prepared for a breakout once volatility expands. Long-term investors may consider accumulating on dips during consolidation phases.