Technical Analysis of BGNE 2024-05-10
Overview:
In analyzing the technical indicators for BGNE over the last 5 days, we will delve into the trend, momentum, volatility, and volume indicators to provide a comprehensive outlook on the possible stock price movement in the coming days. By examining these key aspects, we aim to offer valuable insights and predictions to guide investment decisions.
Trend Indicators:
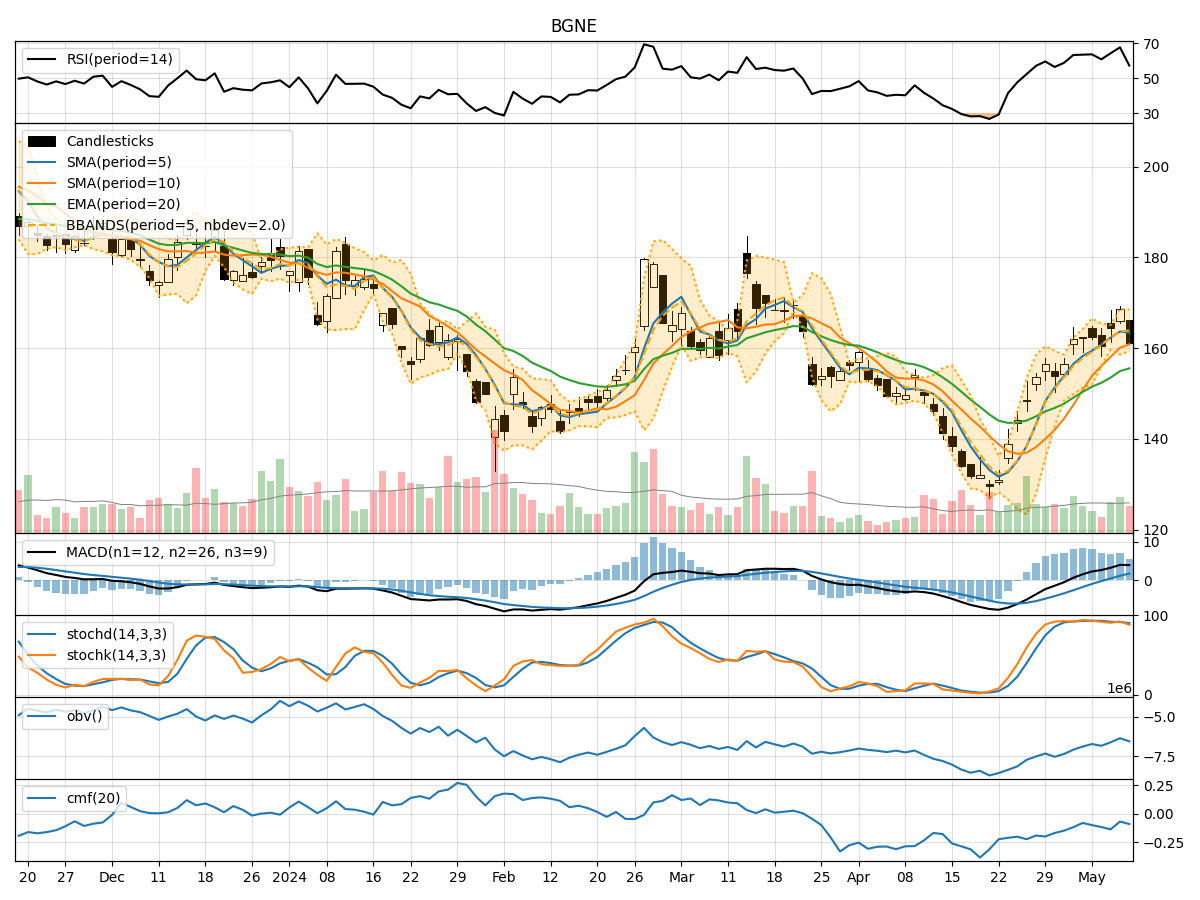
- Moving Averages (MA): The 5-day MA has been showing an upward trend, indicating a positive momentum in the stock price.
- MACD: The MACD line has been consistently above the signal line, suggesting a bullish trend.
- EMA: The EMA has been steadily increasing, reflecting a positive outlook for the stock price.
Momentum Indicators:
- RSI: The RSI has been fluctuating but generally staying within the neutral range, indicating a balanced momentum.
- Stochastic Oscillator: Both %K and %D have been showing a downward trend, signaling a potential reversal in momentum.
- Williams %R: The Williams %R has been in the oversold territory, suggesting a possible buying opportunity.
Volatility Indicators:
- Bollinger Bands: The stock price has been trading within the bands, indicating a period of consolidation.
- Bollinger %B: The %B value has been fluctuating around the midline, suggesting a lack of clear direction in volatility.
Volume Indicators:
- On-Balance Volume (OBV): The OBV has been fluctuating, indicating mixed sentiment among investors.
- Chaikin Money Flow (CMF): The CMF has been negative, reflecting a bearish sentiment in the stock.
Key Observations and Opinions:
- Trend: The stock is currently in an upward trend based on moving averages and MACD.
- Momentum: Momentum indicators are mixed, with RSI neutral, Stochastic showing a potential reversal, and Williams %R in oversold territory.
- Volatility: Bollinger Bands suggest consolidation in the stock price.
- Volume: Volume indicators show mixed sentiment, with OBV fluctuating and CMF negative.
Conclusion:
Based on the analysis of the technical indicators, the next few days for BGNE could see sideways movement with a potential for a slight upward bias. Investors should closely monitor the Stochastic oscillator for a possible reversal in momentum and watch for any breakout from the consolidation phase indicated by the Bollinger Bands. It is advisable to exercise caution and wait for clearer signals before making significant trading decisions.