Technical Analysis of BGLC 2024-05-10
Overview:
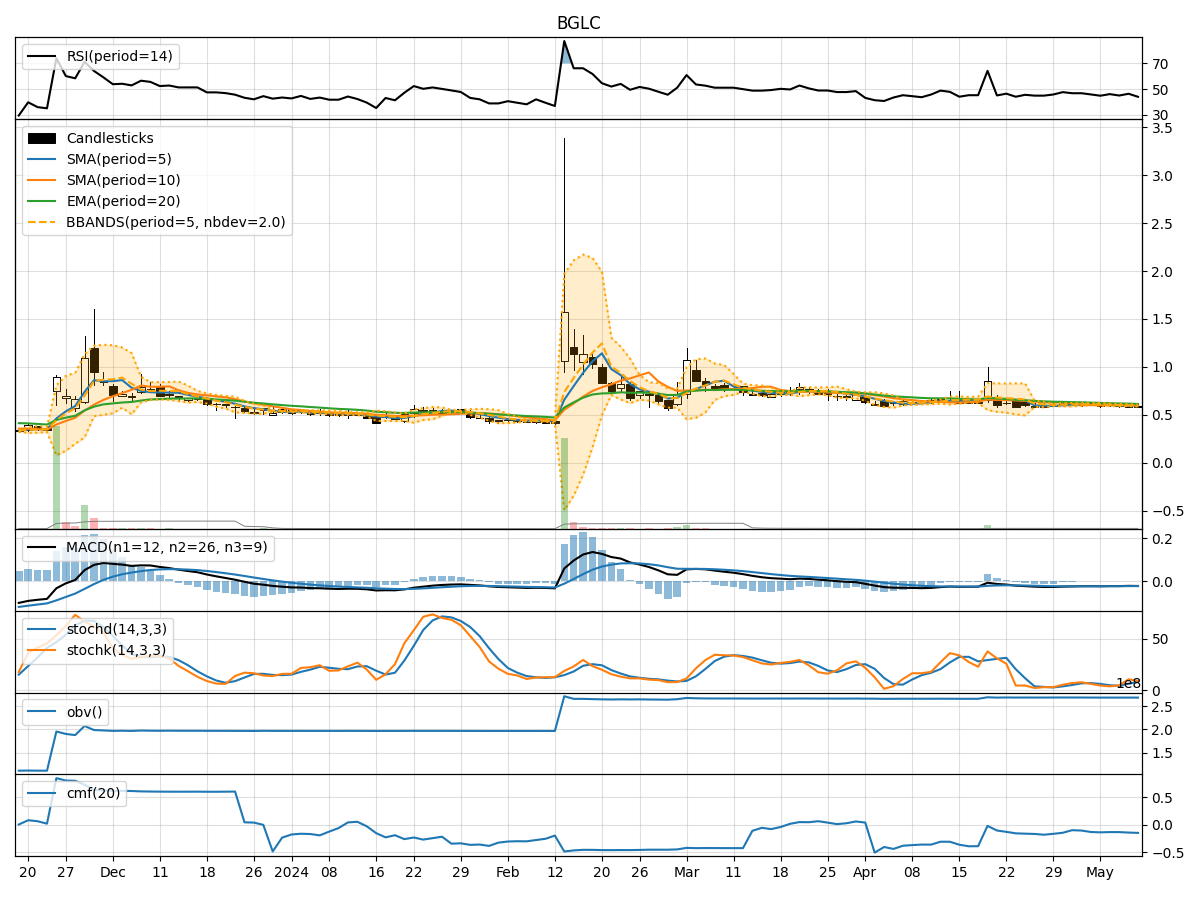
In analyzing the technical indicators for BGLC over the last 5 days, we will delve into the trend, momentum, volatility, and volume indicators to provide a comprehensive outlook on the possible stock price movement. By examining these key aspects, we aim to offer valuable insights and predictions for the upcoming days.
Trend Analysis:
- Moving Averages (MA): The 5-day MA has been consistently below the closing price, indicating a short-term bearish trend.
- MACD: The MACD line has been negative, suggesting a bearish momentum in the stock price.
- EMA: The EMA has been declining, further supporting the bearish trend in the stock.
Key Observation: The trend indicators point towards a bearish outlook for BGLC.
Momentum Analysis:
- RSI: The RSI values have been below 50, indicating a lack of strong buying momentum.
- Stochastic Oscillator: Both %K and %D have been relatively low, signaling a potential oversold condition.
- Williams %R: The indicator has been consistently in the oversold territory, reflecting a bearish sentiment.
Key Observation: Momentum indicators suggest a bearish sentiment in the stock.
Volatility Analysis:
- Bollinger Bands: The stock price has been trading below the lower Bollinger Band, indicating potential oversold conditions.
- Bollinger %B: The %B value has been below 0.2, suggesting a possible undervalued scenario.
Key Observation: Volatility indicators hint at a potential reversal or consolidation in the stock price.
Volume Analysis:
- On-Balance Volume (OBV): The OBV has been fluctuating but not showing a clear trend, indicating indecision in the market.
- Chaikin Money Flow (CMF): The CMF has been negative, reflecting selling pressure in the stock.
Key Observation: Volume indicators suggest a neutral stance with a slight bearish bias.
Conclusion:
Based on the analysis of trend, momentum, volatility, and volume indicators, the overall outlook for BGLC in the next few days appears to be bearish. The stock is likely to continue its downward trend, supported by the negative momentum and bearish trend indicators. However, the volatility indicators hint at a possible reversal or consolidation in the near future.
Key Conclusion: The next few days may see BGLC experiencing further downside movement with a potential for reversal or consolidation based on volatility indicators. Investors should exercise caution and closely monitor the stock's price action for any signs of a trend reversal.