Technical Analysis of BENF 2024-05-10
Overview:
In analyzing the technical indicators for BENF over the last 5 days, we will delve into the trend, momentum, volatility, and volume indicators to provide a comprehensive assessment of the stock's potential price movement. By examining these key factors, we aim to offer valuable insights and predictions for the next few days.
Trend Analysis:
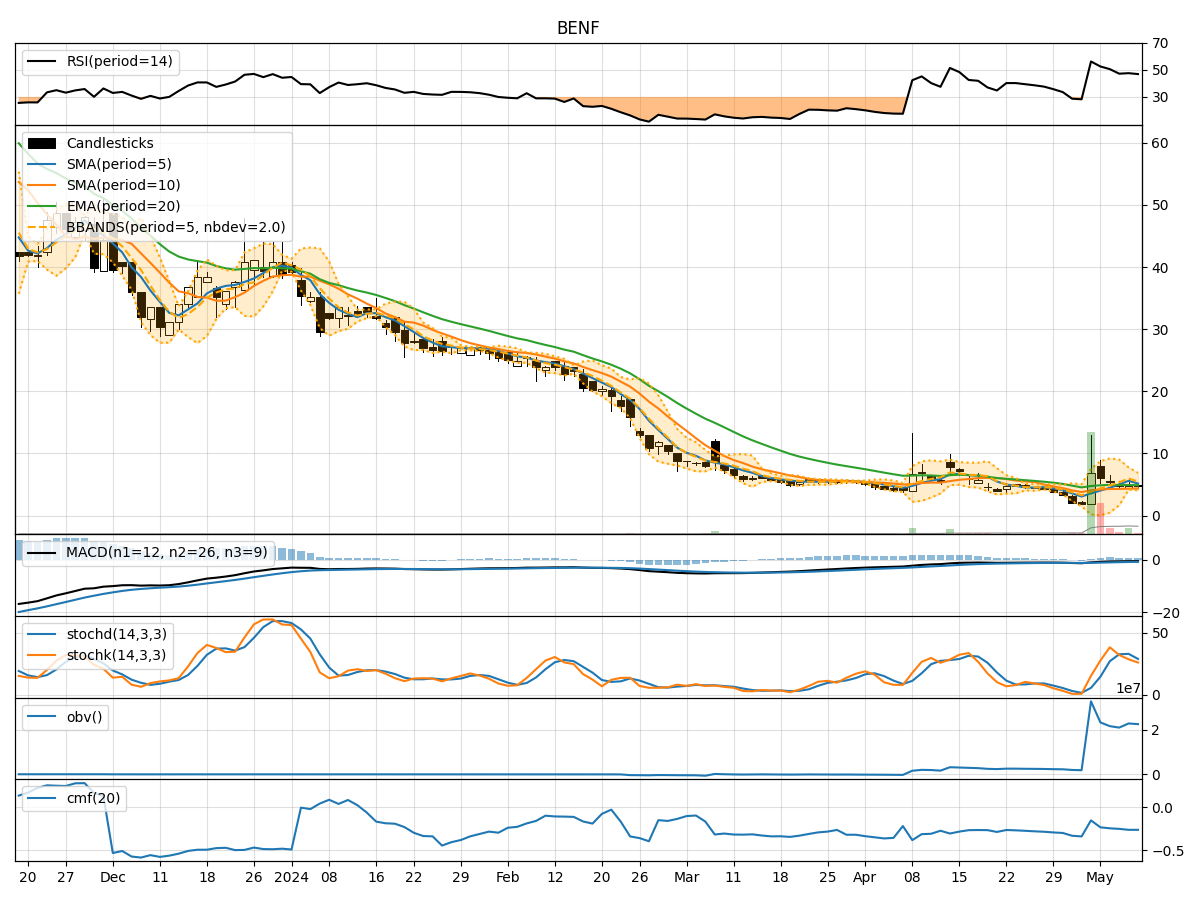
- Moving Averages (MA): The 5-day moving average has been consistently above the closing price, indicating a potential bullish trend.
- MACD: The MACD line has been negative but showing signs of convergence with the signal line, suggesting a possible trend reversal.
- EMA: The exponential moving average has been declining, reflecting recent bearish sentiment.
Momentum Analysis:
- RSI: The Relative Strength Index has been hovering around the neutral zone, indicating a lack of strong momentum in either direction.
- Stochastic Oscillator: Both %K and %D have been in oversold territory, signaling a potential reversal to the upside.
- Williams %R: The Williams %R is in oversold territory, suggesting a possible buying opportunity.
Volatility Analysis:
- Bollinger Bands: The widening of the Bollinger Bands indicates increased volatility, potentially leading to significant price movements.
- Bollinger %B: The %B indicator has been fluctuating, reflecting the volatility in the stock's price.
Volume Analysis:
- On-Balance Volume (OBV): The OBV has been relatively stable, indicating a balance between buying and selling pressure.
- Chaikin Money Flow (CMF): The CMF has been negative, suggesting a net outflow of money from the stock.
Key Observations:
- The trend indicators show a mixed picture, with conflicting signals from moving averages and MACD.
- Momentum indicators suggest a potential reversal in the near term, supported by oversold conditions.
- Volatility is high, indicating the potential for significant price swings.
- Volume indicators point to a balanced market sentiment with a slight bias towards selling pressure.
Conclusion:
Based on the analysis of the technical indicators, the next few days for BENF could see sideways consolidation with a slight bullish bias. Traders should closely monitor the momentum indicators for signs of a potential reversal and keep an eye on volatility for possible trading opportunities. It is essential to exercise caution and wait for confirmation from multiple indicators before making trading decisions.