Technical Analysis of BCYC 2024-05-10
Overview:
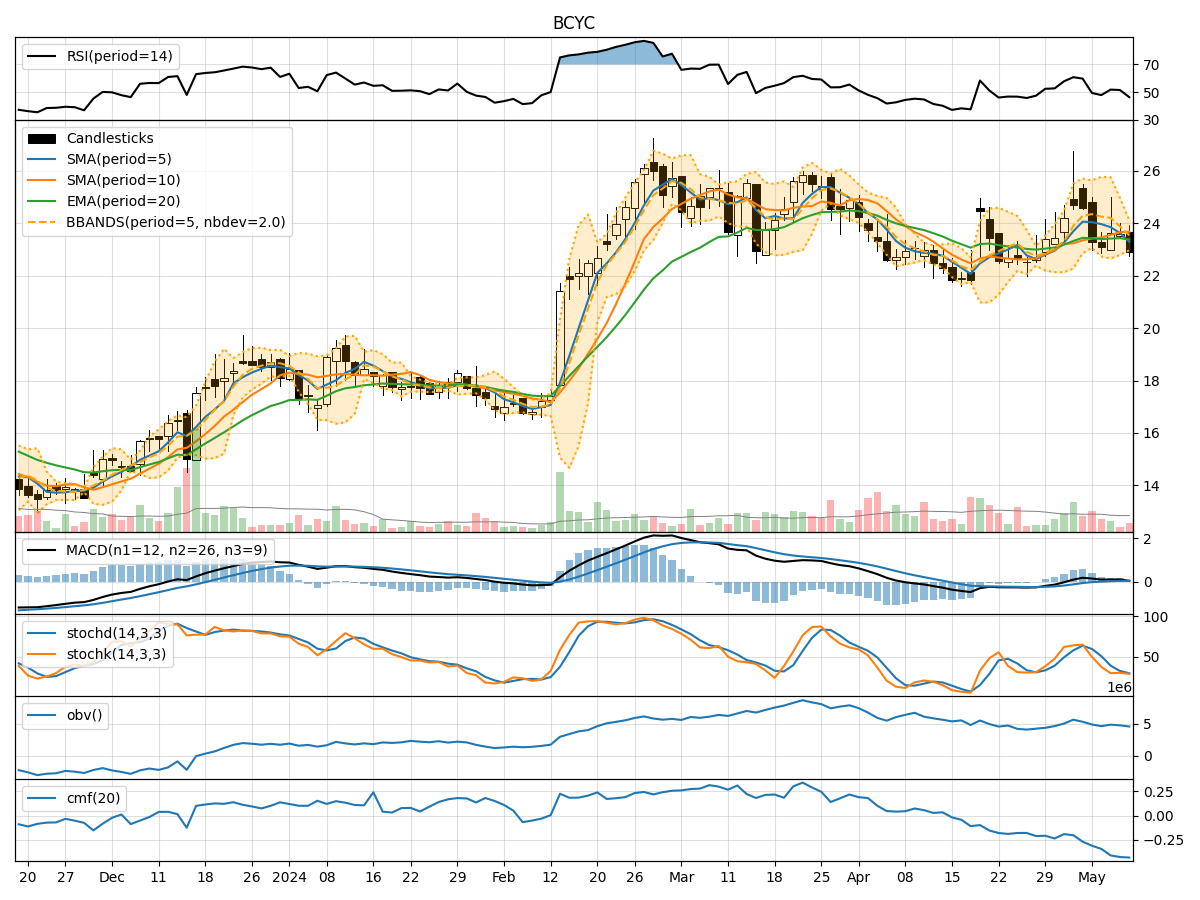
In analyzing the technical indicators for BCYC over the last 5 days, we will delve into the trend, momentum, volatility, and volume indicators to provide a comprehensive outlook on the possible stock price movement. By examining these key aspects, we aim to offer valuable insights and predictions for the upcoming days.
Trend Analysis:
- Moving Averages (MA): The 5-day MA has been consistently below the closing price, indicating a short-term bearish trend.
- MACD: The MACD line has been fluctuating around the signal line, suggesting indecision in the market momentum.
Key Observation: The trend indicators reflect a lack of clear direction in the stock price movement.
Momentum Analysis:
- RSI: The RSI has been hovering around the neutral zone, indicating a balanced momentum between buying and selling pressure.
- Stochastic Oscillator: Both %K and %D have been relatively low, signaling a potential oversold condition.
Key Observation: Momentum indicators suggest a lack of strong buying or selling pressure in the market.
Volatility Analysis:
- Bollinger Bands (BB): The bands have been narrowing, indicating decreasing volatility in the stock price.
Key Observation: Volatility has been decreasing, potentially leading to a period of consolidation or a breakout.
Volume Analysis:
- On-Balance Volume (OBV): The OBV has been declining, suggesting selling pressure in the market.
- Chaikin Money Flow (CMF): The CMF has been negative, indicating a lack of buying interest.
Key Observation: Volume indicators point towards a bearish sentiment in the market.
Conclusion:
Based on the analysis of the technical indicators, the stock price of BCYC is likely to experience further downward movement in the next few days. The trend indicators show a lack of clear direction, while momentum indicators suggest a balanced market sentiment with a potential oversold condition. Decreasing volatility and negative volume indicators support the bearish outlook.
Recommendation:
- Short-Term Traders: Consider short positions or staying on the sidelines until a clearer trend emerges.
- Long-Term Investors: Monitor the price action closely and wait for a more favorable entry point before considering any long positions.
Disclaimer:
Remember that market conditions can change rapidly, and it is essential to continuously monitor the stock's performance and adjust your strategy accordingly. Technical analysis provides valuable insights, but it should be used in conjunction with other forms of analysis for well-informed decision-making.