Technical Analysis of BBCP 2024-05-31
Overview:
In analyzing the technical indicators for BBCP over the last 5 days, we will delve into the trend, momentum, volatility, and volume indicators to provide a comprehensive assessment of the stock's potential price movement. By examining these key factors, we aim to offer valuable insights and predictions for the upcoming days.
Trend Analysis:
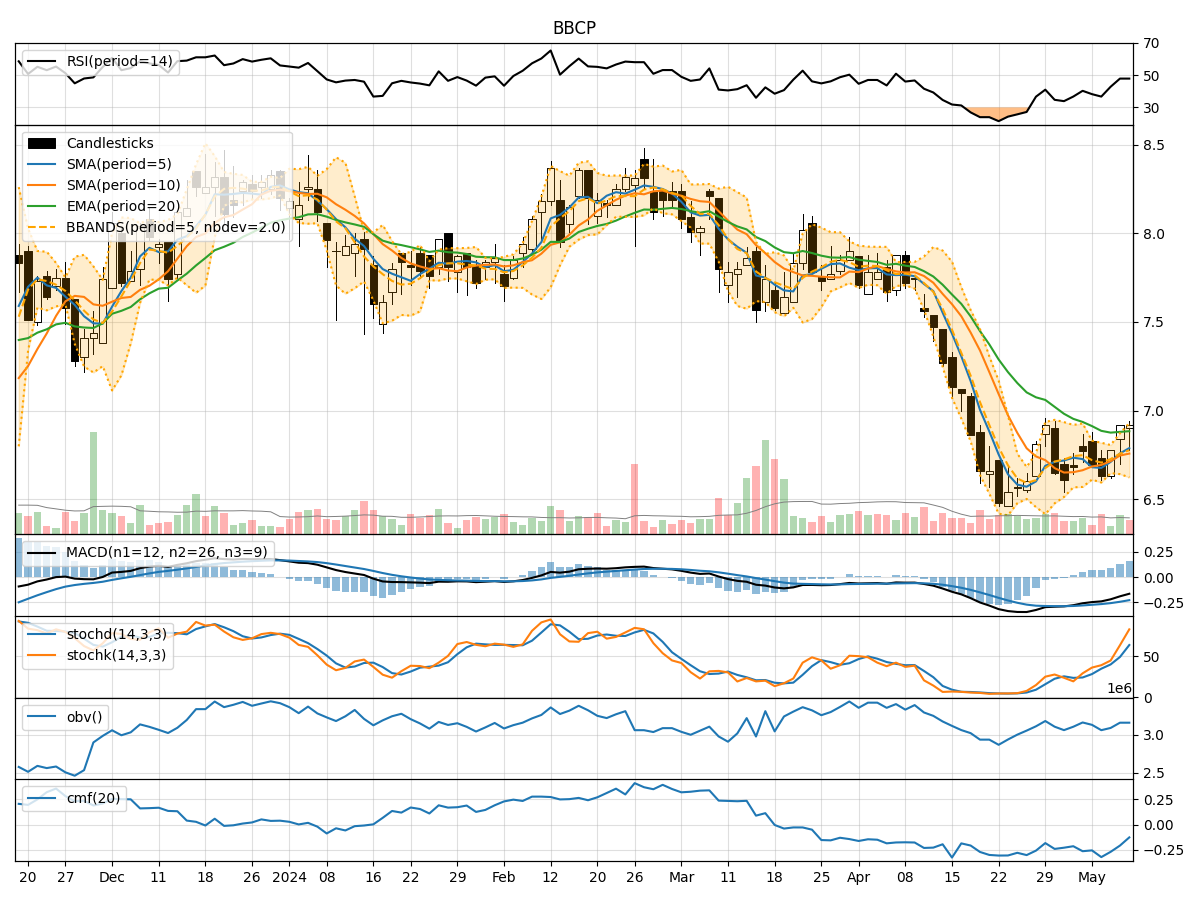
- Moving Averages (MA): The 5-day Moving Average (MA) has been consistently above the Simple Moving Average (SMA) and Exponential Moving Average (EMA), indicating a bullish trend.
- MACD: The MACD line has been consistently above the signal line, with both lines showing an upward trend, suggesting bullish momentum.
- RSI: The Relative Strength Index (RSI) has been fluctuating around the 50 level, indicating a neutral stance in terms of momentum.
Momentum Analysis:
- Stochastic Oscillator: The Stochastic Oscillator has been in the overbought region, suggesting a potential reversal or consolidation in the near future.
- Williams %R: The Williams %R indicator has been hovering in the oversold region, indicating a potential buying opportunity.
Volatility Analysis:
- Bollinger Bands (BB): The Bollinger Bands have been narrowing, indicating decreasing volatility and a possible period of consolidation.
- Volatility Percentage (BBP): The Volatility Percentage has been decreasing, further supporting the notion of reduced volatility.
Volume Analysis:
- On-Balance Volume (OBV): The OBV has shown mixed signals, with fluctuations in volume accumulation, suggesting indecision among market participants.
- Chaikin Money Flow (CMF): The CMF has been positive, indicating buying pressure in the market.
Key Observations:
- The trend indicators suggest a bullish sentiment, supported by the MACD and moving averages.
- Momentum indicators show conflicting signals, with the Stochastic Oscillator in overbought territory and the Williams %R in oversold territory.
- Volatility indicators point towards a potential period of consolidation, as indicated by the narrowing Bollinger Bands.
- Volume indicators reflect mixed signals, with OBV showing fluctuations and CMF indicating buying pressure.
Conclusion:
Based on the analysis of the technical indicators, the next few days for BBCP could see sideways movement or consolidation as the stock appears to be in a transition phase. Traders should exercise caution and closely monitor key levels such as support and resistance for potential breakout opportunities. The conflicting signals from momentum indicators suggest a lack of clear direction, reinforcing the need for patience and vigilance in trading decisions.