Technical Analysis of AZ 2024-05-10
Overview:
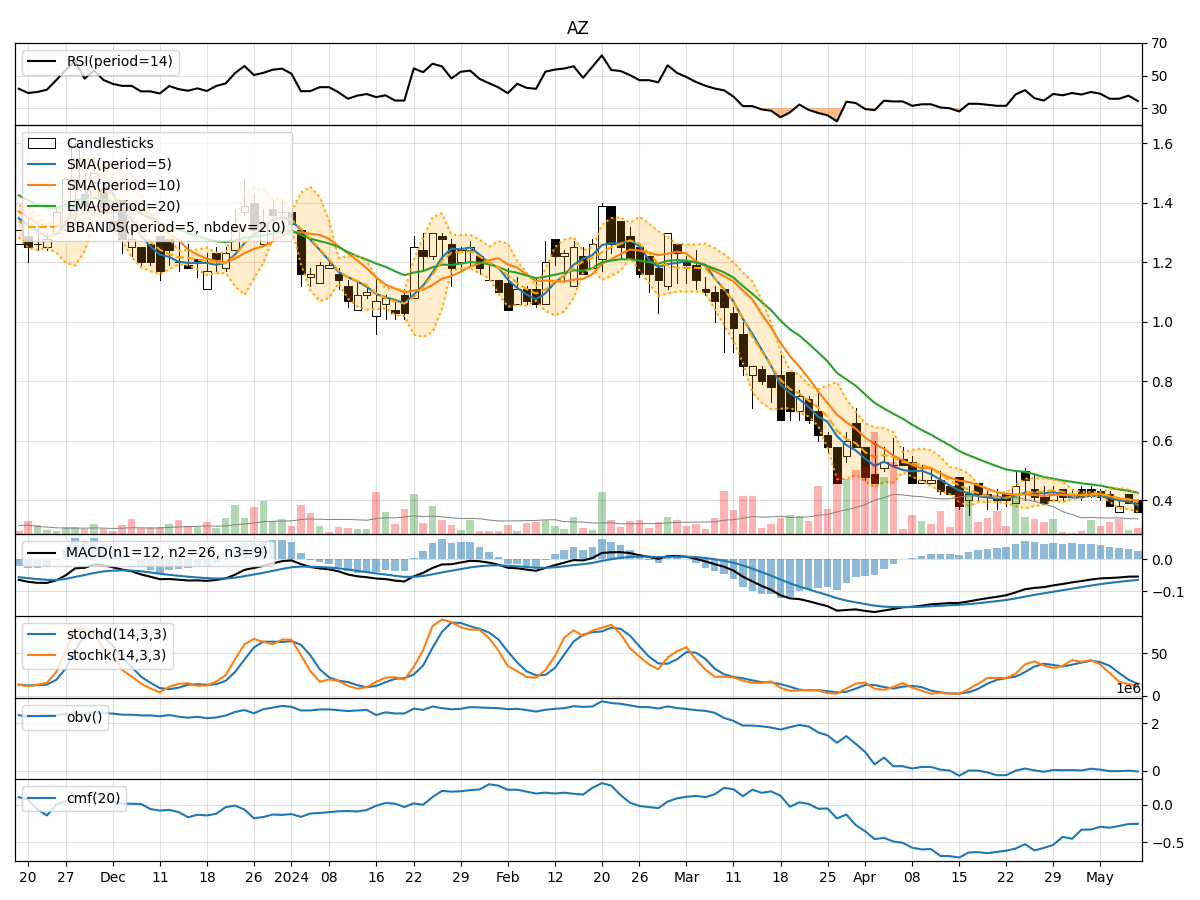
In analyzing the technical indicators for AZ stock over the last 5 days, we will delve into the trend, momentum, volatility, and volume indicators to provide a comprehensive outlook on the possible stock price movement in the coming days. By examining these key indicators, we aim to offer valuable insights and predictions to guide investment decisions.
Trend Analysis:
- Moving Averages (MA): The 5-day MA has been consistently below the closing prices, indicating a short-term downtrend.
- MACD: The MACD line has been negative, suggesting bearish momentum in the stock.
- EMA: The EMA values have been declining, further supporting the bearish trend.
Key Observation: The trend indicators point towards a downward trajectory for AZ stock.
Momentum Analysis:
- RSI: The RSI values have been below 50, indicating bearish momentum.
- Stochastic Oscillator: Both %K and %D values have been decreasing, signaling a potential continuation of the downtrend.
- Williams %R: The values have been in the oversold territory, suggesting a bearish sentiment.
Key Observation: Momentum indicators reflect a bearish sentiment in the stock.
Volatility Analysis:
- Bollinger Bands: The stock price has been consistently below the lower Bollinger Band, indicating oversold conditions.
- Bollinger %B: The %B values have been below 0.2, suggesting a potential reversal or bounce.
Key Observation: Volatility indicators hint at a possible reversal or bounce in the stock price.
Volume Analysis:
- On-Balance Volume (OBV): The OBV values have been declining, indicating selling pressure.
- Chaikin Money Flow (CMF): The CMF values have been negative, signaling a lack of buying interest.
Key Observation: Volume indicators support the bearish outlook for the stock.
Conclusion:
Based on the analysis of trend, momentum, volatility, and volume indicators, the overall outlook for AZ stock in the next few days is bearish. The stock is likely to continue its downward trend, supported by the negative momentum and volume pressure. However, the oversold conditions indicated by volatility indicators suggest a potential reversal or bounce in the near future. Traders should exercise caution and consider waiting for confirmation of a reversal before considering any long positions.
Key Conclusion:
The stock is expected to continue its downward trajectory in the short term, with a possibility of a reversal indicated by oversold conditions. Investors should closely monitor the price action and key support levels for potential entry points.