Technical Analysis of AVDL 2024-05-10
Overview:
In analyzing the technical indicators for AVDL over the last 5 days, we will delve into the trend, momentum, volatility, and volume indicators to provide a comprehensive outlook on the possible stock price movement in the coming days.
Trend Analysis:
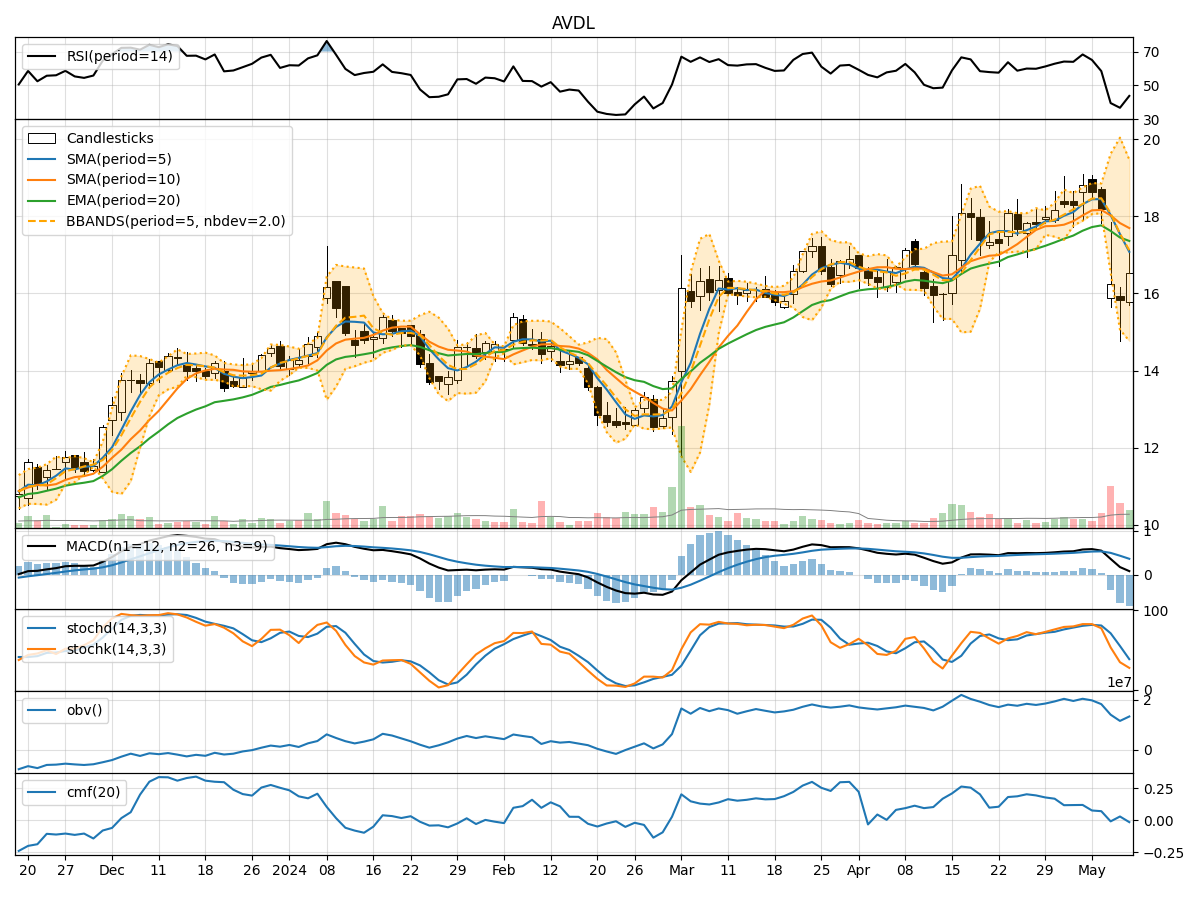
- Moving Averages (MA): The 5-day Moving Average (MA) has been fluctuating around the closing prices, indicating short-term price trends. The Simple Moving Average (SMA) and Exponential Moving Average (EMA) show a slight divergence, with EMA being more responsive to recent price changes.
- MACD: The Moving Average Convergence Divergence (MACD) has been positive but decreasing, suggesting a potential slowdown in the bullish momentum.
- Conclusion: The trend indicators show a mixed signal with a slight bearish bias due to the decreasing MACD.
Momentum Analysis:
- RSI: The Relative Strength Index (RSI) has been fluctuating in the neutral zone, indicating indecision in the market.
- Stochastic Oscillator: Both %K and %D of the Stochastic Oscillator are in oversold territory, suggesting a possible reversal in the short term.
- Conclusion: Momentum indicators signal a neutral to slightly bearish sentiment, with potential for a short-term reversal based on the Stochastic Oscillator.
Volatility Analysis:
- Bollinger Bands (BB): The Bollinger Bands have been narrowing, indicating decreasing volatility and a potential breakout in the near future.
- Conclusion: Volatility indicators suggest a period of consolidation and potential for a significant price movement as the Bollinger Bands tighten.
Volume Analysis:
- On-Balance Volume (OBV): The OBV has been fluctuating, indicating mixed buying and selling pressure.
- Chaikin Money Flow (CMF): The CMF has been negative, reflecting a lack of strong buying interest.
- Conclusion: Volume indicators show a lack of clear direction, with no significant accumulation or distribution signals.
Overall Conclusion:
Based on the analysis of the technical indicators, the next few days for AVDL are likely to see sideways movement with a potential for a breakout. The trend indicators suggest a slight bearish bias, while momentum indicators signal a neutral to slightly bearish sentiment. Volatility indicators point towards a period of consolidation before a potential significant price movement. Volume indicators do not provide a clear direction but indicate a lack of strong buying interest.
Recommendation:
- Short-term Traders: Consider waiting for a clear breakout signal before taking a position.
- Long-term Investors: Monitor the price action closely for a potential entry point or confirmation of a trend reversal.
Disclaimer:
Remember that technical analysis is not a guaranteed predictor of future price movements, and other fundamental factors can influence stock prices. It is essential to conduct thorough research and consider multiple indicators before making any investment decisions. Consulting with a financial advisor is recommended for personalized investment advice.