Technical Analysis of AVAV 2024-05-31
Overview:
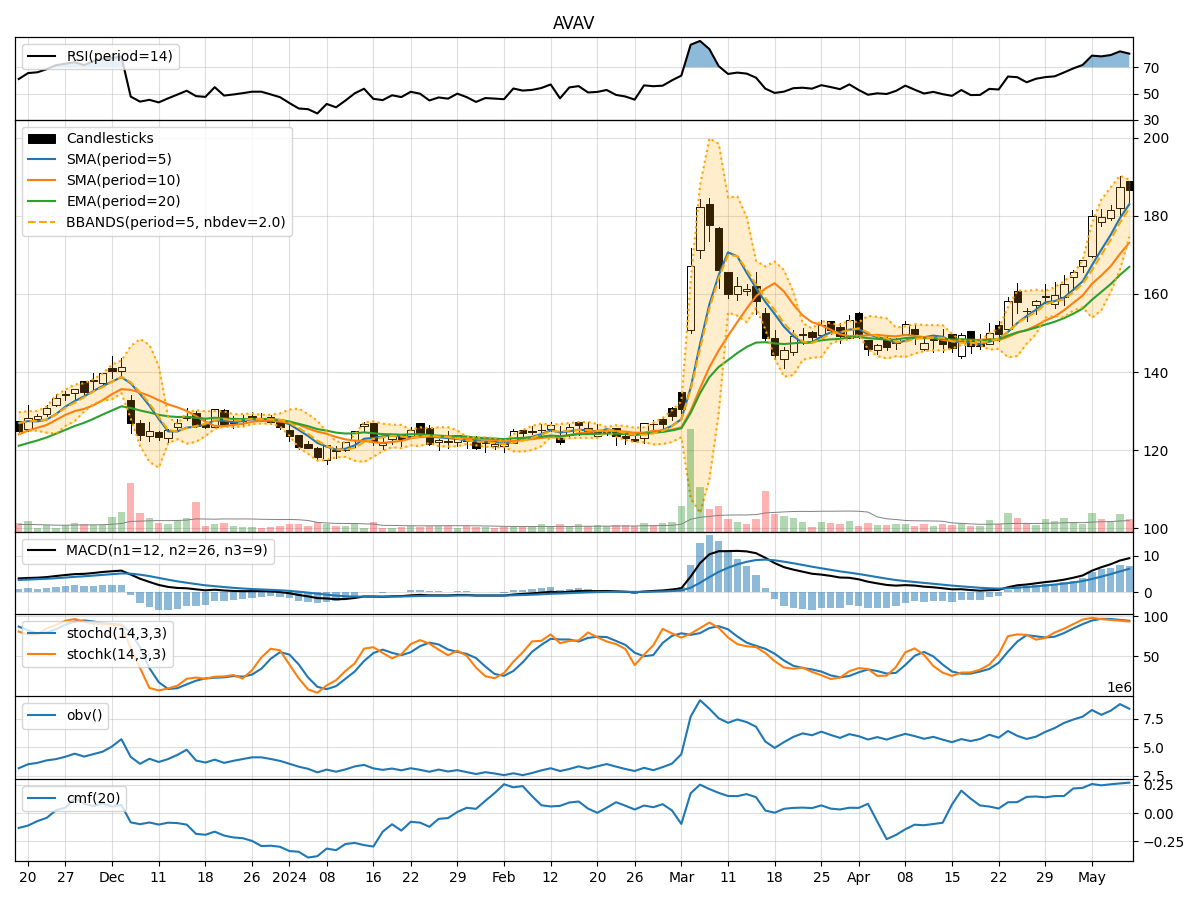
In analyzing the technical indicators for AVAV over the last 5 days, we will delve into the trend, momentum, volatility, and volume indicators to provide a comprehensive outlook on the possible stock price movement in the coming days. By examining these key aspects, we aim to offer valuable insights and predictions for informed decision-making.
Trend Indicators:
- Moving Averages (MA): The 5-day moving average has been consistently above the longer-term SMAs and EMAs, indicating a short-term bullish trend.
- MACD: The MACD line has been above the signal line, suggesting positive momentum in the stock price.
- MACD Histogram: The MACD histogram has been decreasing but remains in positive territory, signaling a potential slowdown in momentum.
Momentum Indicators:
- RSI: The RSI has been relatively high but has shown a slight decline, indicating a possible weakening of buying pressure.
- Stochastic Oscillator: Both %K and %D have been decreasing, pointing towards a potential shift from overbought conditions.
- Williams %R: The Williams %R is in oversold territory, suggesting a possible reversal in the short term.
Volatility Indicators:
- Bollinger Bands: The stock price has been trading within the upper Bollinger Band, indicating an overbought condition.
- Bollinger Band Width: The Band Width has been narrowing, suggesting a potential decrease in volatility.
- Bollinger Band %B: The %B indicator is above 0.8, indicating a potential overbought situation.
Volume Indicators:
- On-Balance Volume (OBV): The OBV has shown a slight increase, indicating accumulation by investors.
- Chaikin Money Flow (CMF): The CMF has been positive, suggesting buying pressure in the stock.
Key Observations and Opinions:
- Trend: The stock is in a short-term bullish trend based on moving averages and MACD.
- Momentum: Momentum indicators show a potential weakening of buying pressure and a shift from overbought conditions.
- Volatility: The stock is currently in an overbought condition based on Bollinger Bands.
- Volume: Accumulation is observed based on OBV and CMF indicators.
Conclusion:
Based on the analysis of the technical indicators, the next few days' possible stock price movement for AVAV is likely to experience a short-term correction or consolidation. The stock may see a pullback from overbought levels as momentum weakens and buying pressure subsides. Traders should exercise caution and consider potential entry points during the consolidation phase.