Technical Analysis of AUPH 2024-05-10
Overview:
In analyzing the technical indicators for AUPH over the last 5 days, we will delve into the trend, momentum, volatility, and volume indicators to provide a comprehensive outlook on the possible stock price movement. By examining these key aspects, we aim to offer valuable insights and predictions for the upcoming days.
Trend Analysis:
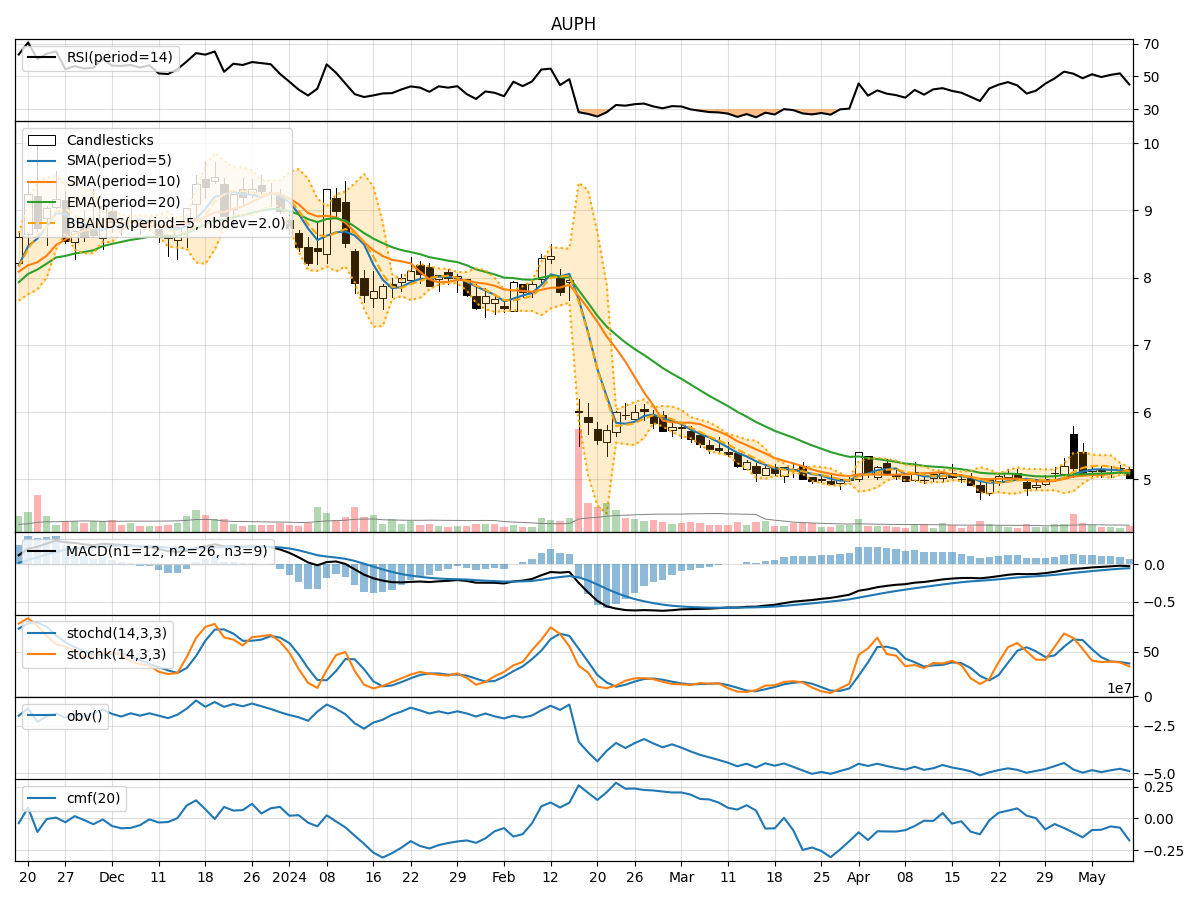
- Moving Averages (MA): The 5-day MA has been fluctuating around the closing prices, indicating short-term price trends. The SMA(10) and EMA(20) have shown slight variations but have not diverged significantly.
- MACD: The MACD line has been consistently below the signal line, suggesting a bearish trend. However, the gap between the two lines has been narrowing, indicating a potential reversal.
- Conclusion: The trend indicators point towards a sideways movement with a potential bullish reversal in the near future.
Momentum Analysis:
- RSI: The RSI values have been hovering around the mid-range, indicating a balanced momentum between buying and selling pressure.
- Stochastic Oscillator: Both %K and %D values have been declining, signaling a weakening momentum.
- Williams %R: The indicator has been in the oversold territory, suggesting a potential buying opportunity.
- Conclusion: The momentum indicators suggest a neutral to slightly bearish sentiment in the market.
Volatility Analysis:
- Bollinger Bands: The stock price has been trading within the bands, with the lower band acting as a support level.
- Bollinger %B: The %B value has been fluctuating, indicating moderate volatility.
- Conclusion: Volatility indicators imply a stable price movement with no significant deviations expected in the short term.
Volume Analysis:
- On-Balance Volume (OBV): The OBV values have been fluctuating, indicating mixed buying and selling pressure.
- Chaikin Money Flow (CMF): The CMF values have been negative, suggesting a net outflow of money from the stock.
- Conclusion: Volume indicators reflect a lack of strong buying interest and a slight bearish bias in the market sentiment.
Overall Conclusion:
Based on the analysis of trend, momentum, volatility, and volume indicators, the next few days for AUPH are likely to see sideways movement with a potential bullish reversal in the trend. The momentum remains neutral to slightly bearish, while volatility indicates stability in price fluctuations. However, the volume indicators suggest a lack of strong buying interest. Traders should closely monitor the MACD for a potential bullish crossover and the RSI for any signs of increasing buying pressure. Consider a cautious approach with a slight bullish bias in the short term.
Disclaimer:
Remember that technical analysis is not a guaranteed predictor of future price movements, and other fundamental factors can influence stock prices. It is essential to conduct thorough research and consider multiple indicators before making any investment decisions. Consulting with a financial advisor is recommended for personalized guidance tailored to your specific investment goals and risk tolerance level.