Technical Analysis of ATXG 2024-05-10
Overview:
In analyzing the technical indicators for ATXG over the last 5 days, we will delve into the trend, momentum, volatility, and volume indicators to provide a comprehensive outlook on the possible stock price movement in the coming days. By examining these key aspects, we aim to offer valuable insights and recommendations for potential investors.
Trend Analysis:
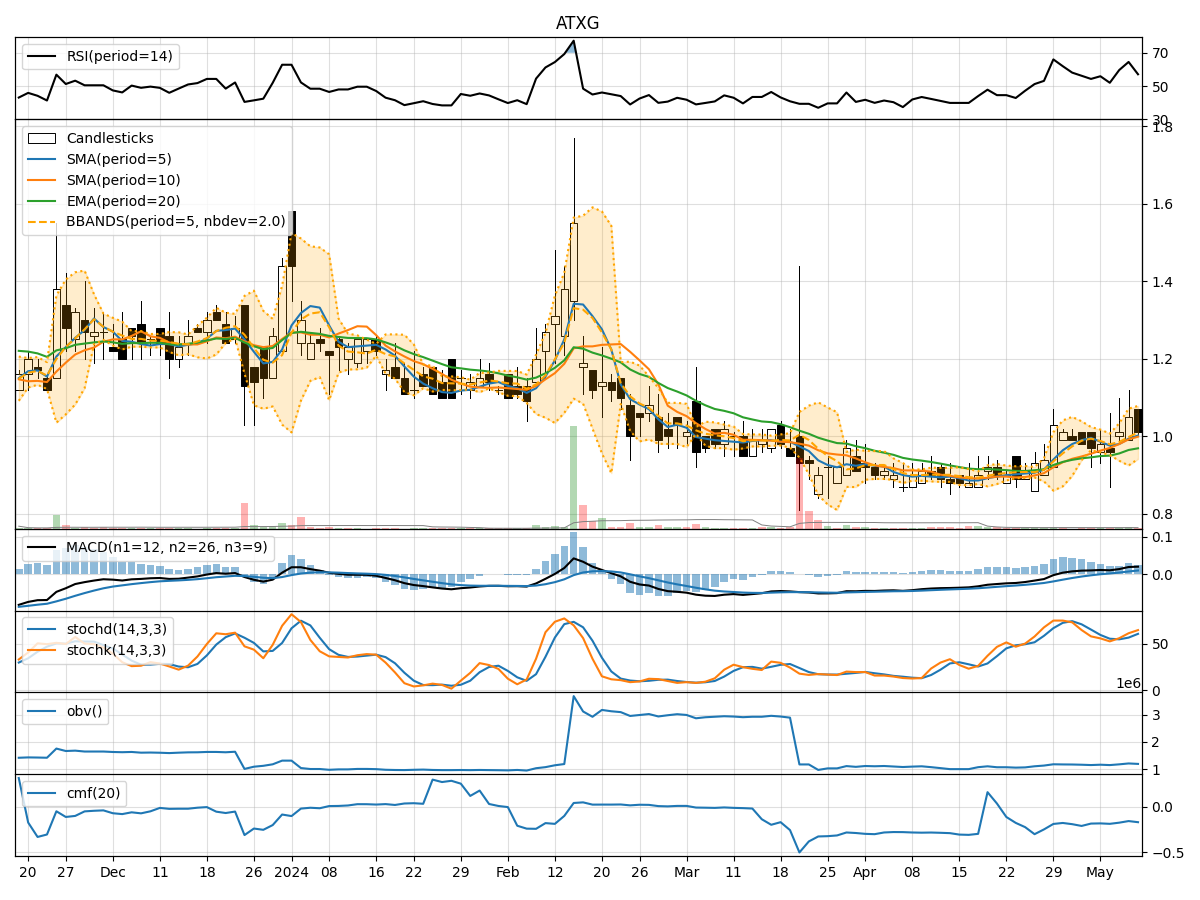
- Moving Averages (MA): The 5-day Moving Average (MA) has been fluctuating around the actual closing prices, indicating short-term price trends. The Simple Moving Average (SMA) and Exponential Moving Average (EMA) have shown an upward trend, suggesting a positive momentum in the stock price.
- MACD: The Moving Average Convergence Divergence (MACD) has been consistently positive, with the MACD line above the signal line. This signals a bullish trend in the stock price.
- Conclusion: The trend indicators suggest an upward momentum in the stock price.
Momentum Analysis:
- RSI: The Relative Strength Index (RSI) has been fluctuating around the 50 level, indicating a balanced momentum between buying and selling pressure.
- Stochastic Oscillator: Both %K and %D have been in the overbought territory, suggesting a potential reversal in the stock price.
- Conclusion: The momentum indicators imply a neutral to slightly bearish sentiment in the stock price.
Volatility Analysis:
- Bollinger Bands (BB): The Bollinger Bands have widened, indicating increased volatility in the stock price. The current price is hovering around the upper band, suggesting a potential overbought condition.
- Conclusion: The volatility indicators point towards increased volatility in the stock price, potentially leading to a correction.
Volume Analysis:
- On-Balance Volume (OBV): The OBV has shown a slight increase, indicating a positive volume flow into the stock.
- Chaikin Money Flow (CMF): The CMF has been negative, suggesting a bearish money flow in the stock.
- Conclusion: The volume indicators present a mixed signal, with OBV showing some buying interest but CMF reflecting bearish money flow.
Overall Conclusion:
Based on the analysis of the technical indicators, the stock of ATXG is likely to experience increased volatility in the coming days, potentially leading to a correction in the stock price. While the trend indicators suggest an upward momentum, the momentum and volume indicators point towards a neutral to slightly bearish sentiment. Investors should exercise caution and consider potential profit-taking opportunities in the short term.
Recommendation:
Considering the mixed signals from the technical indicators, it is advisable for investors to closely monitor the stock price movement and set appropriate stop-loss levels to manage risk effectively. Additionally, conducting further research on fundamental factors impacting the stock can provide a more holistic view before making any investment decisions.