Technical Analysis of ATPC 2024-05-10
Overview:
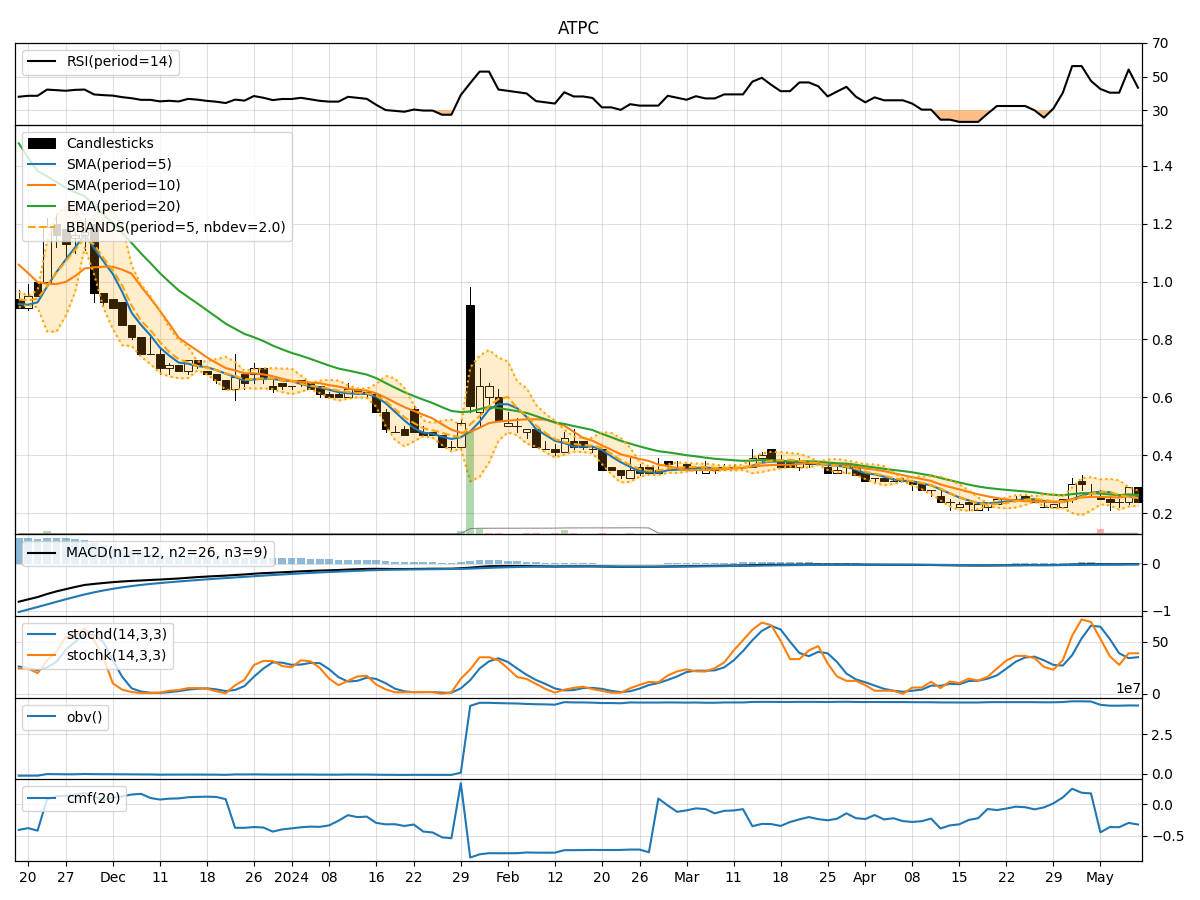
In the last 5 trading days, ATPC stock has shown mixed signals across various technical indicators. The stock price has fluctuated within a range, with some indicators suggesting potential weakness while others hint at possible strength. By analyzing trend, momentum, volatility, and volume indicators, we can gain a comprehensive understanding of the stock's potential future movements.
Trend Indicators:
- Moving Averages (MA): The 5-day MA has been below the 10-day SMA, indicating a short-term bearish trend. However, the EMA(20) has shown some resilience.
- MACD: The MACD line has been consistently below the signal line, suggesting bearish momentum.
- Conclusion: The trend indicators point towards a downward trend in the short term.
Momentum Indicators:
- RSI: The RSI has been fluctuating around the neutral zone, indicating indecision in the market.
- Stochastic Oscillator: Both %K and %D have been hovering in the oversold territory, signaling potential buying opportunities.
- Conclusion: Momentum indicators suggest a sideways movement with a slight bullish bias.
Volatility Indicators:
- Bollinger Bands: The stock price has been trading within the bands, indicating normal volatility.
- Conclusion: Volatility indicators suggest a stable price movement in the near future.
Volume Indicators:
- On-Balance Volume (OBV): The OBV has been negative, indicating distribution of the stock.
- Chaikin Money Flow (CMF): The CMF has been negative, suggesting selling pressure.
- Conclusion: Volume indicators point towards a bearish sentiment in the market.
Overall Conclusion:
Based on the analysis of trend, momentum, volatility, and volume indicators, the next few days' possible stock price movement for ATPC is likely to be downward with sideways consolidation. The trend indicators indicate a bearish bias, while momentum indicators suggest a lack of clear direction. Volatility indicators point towards stability, but volume indicators indicate selling pressure. Therefore, investors should exercise caution and consider waiting for more definitive signals before making any significant trading decisions.