Technical Analysis of ATHE 2024-05-10
Overview:
In analyzing the technical indicators for ATHE over the last 5 days, we will delve into the trend, momentum, volatility, and volume indicators to provide a comprehensive outlook on the possible stock price movement in the coming days. By examining these key aspects, we aim to offer valuable insights and recommendations for potential investors.
Trend Indicators:
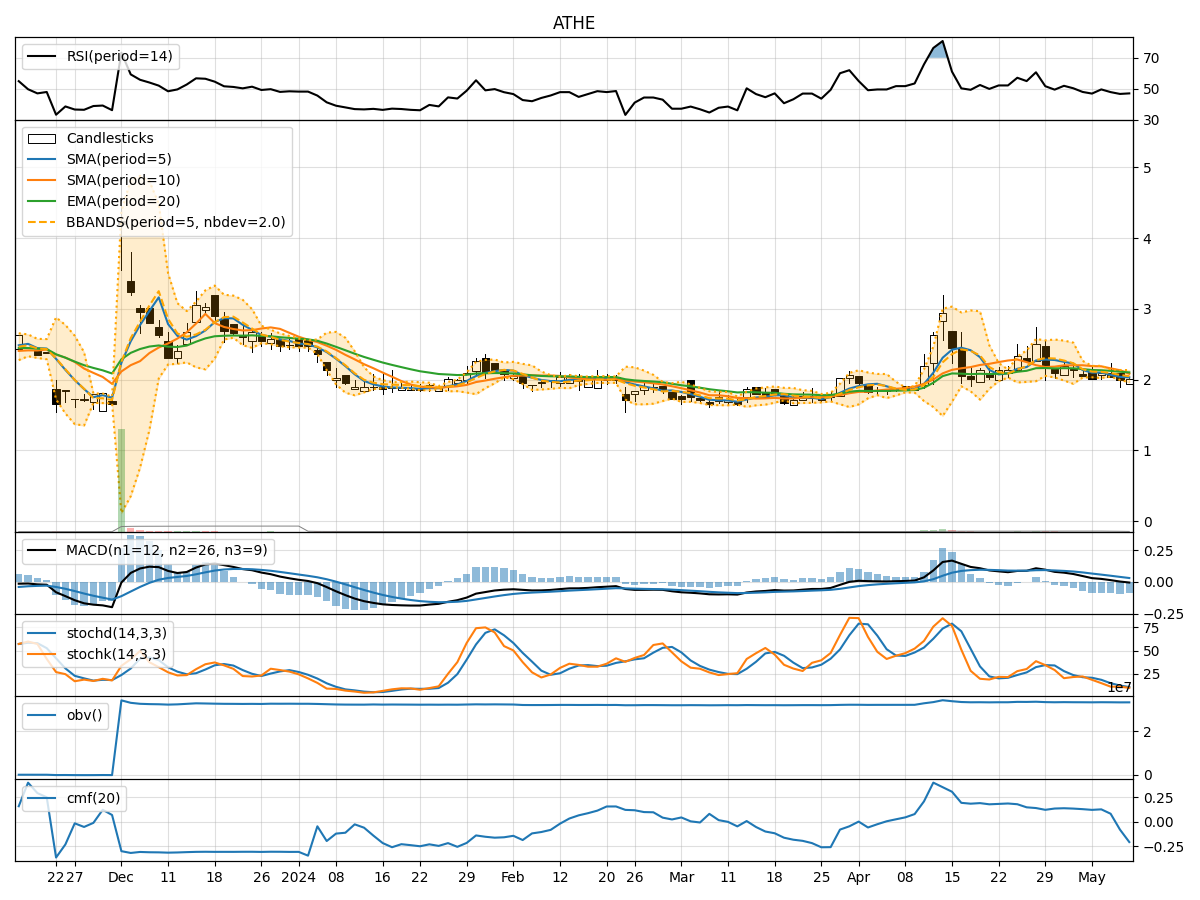
- Moving Averages (MA): The 5-day MA has been fluctuating around the stock price, indicating a lack of clear trend direction.
- MACD: The MACD line has been consistently below the signal line, suggesting a bearish momentum in the short term.
- EMA: The EMA has been gradually declining, reflecting a downward trend in the stock price.
Momentum Indicators:
- RSI: The RSI has been hovering around the neutral zone, indicating a lack of strong momentum either bullish or bearish.
- Stochastic Oscillator: Both %K and %D have been decreasing, signaling a potential bearish momentum.
- Williams %R: The indicator has been in the oversold territory, suggesting a possible reversal in the stock price.
Volatility Indicators:
- Bollinger Bands: The bands have been narrowing, indicating decreasing volatility and a potential period of consolidation.
- Bollinger %B: The %B has been fluctuating around the midline, reflecting a balanced market sentiment.
Volume Indicators:
- On-Balance Volume (OBV): The OBV has been relatively stable, suggesting a neutral volume flow.
- Chaikin Money Flow (CMF): The CMF has been negative, indicating selling pressure in the stock.
Key Observations:
- The trend indicators show a bearish bias with declining moving averages and MACD below the signal line.
- Momentum indicators suggest a lack of strong momentum but leaning towards a bearish sentiment.
- Volatility indicators point towards a period of consolidation with decreasing volatility.
- Volume indicators indicate a neutral volume flow with a slight selling pressure.
Conclusion:
Based on the analysis of the technical indicators, the outlook for ATHE in the next few days is bearish. The trend indicators, momentum indicators, and volume indicators collectively suggest a potential downward movement in the stock price. The narrowing Bollinger Bands and negative CMF further support this bearish view. Investors should exercise caution and consider waiting for more positive signals before considering any long positions.