Technical Analysis of ATAI 2024-05-10
Overview:
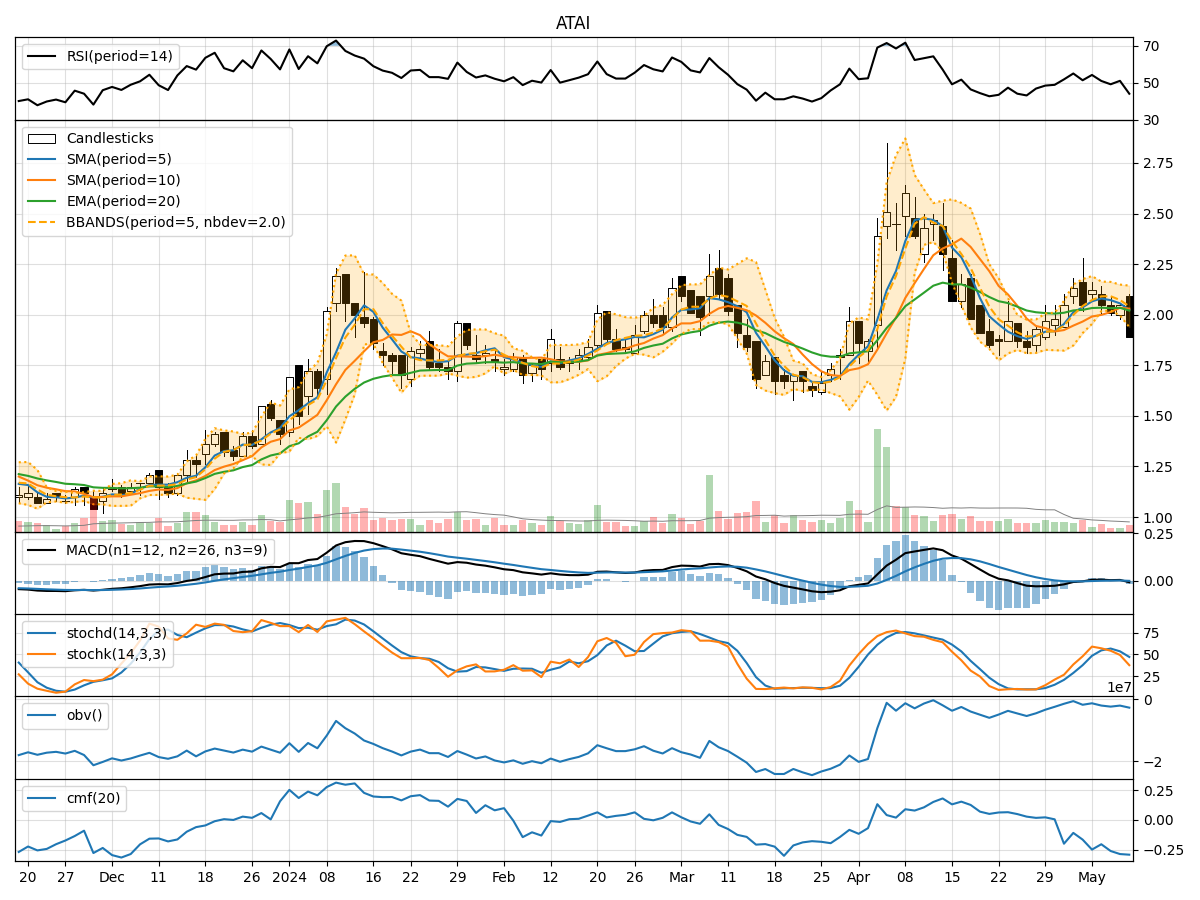
In the last 5 trading days, ATAI stock has shown a mixed performance with fluctuations in price and volume. The technical indicators across trend, momentum, volatility, and volume provide valuable insights into the stock's potential future movements. Let's analyze each category of indicators to determine the possible stock price movement in the next few days.
Trend Indicators:
- Moving Averages (MA): The 5-day Moving Average (MA) has been fluctuating around the closing prices, indicating short-term price trends. The Simple Moving Average (SMA) and Exponential Moving Average (EMA) show a similar pattern, with slight variations.
- MACD: The Moving Average Convergence Divergence (MACD) has been oscillating around the signal line, suggesting a lack of strong momentum in either direction.
- MACD Histogram: The MACD Histogram has been hovering around the zero line, indicating a balance between bullish and bearish momentum.
Momentum Indicators:
- RSI: The Relative Strength Index (RSI) has been fluctuating around the 50 level, indicating a neutral momentum in the stock.
- Stochastic Oscillator: Both %K and %D lines of the Stochastic Oscillator have been moving towards the oversold region, suggesting a potential reversal in the stock's price.
- Williams %R: The Williams %R is in the oversold territory, indicating a possible buying opportunity.
Volatility Indicators:
- Bollinger Bands: The Bollinger Bands are narrowing, suggesting a period of low volatility. The bands may act as support and resistance levels in the near term.
- Bollinger %B: The %B indicator is close to 0, indicating that the stock is trading near the lower band, potentially signaling an oversold condition.
Volume Indicators:
- On-Balance Volume (OBV): The OBV has been declining, indicating that selling pressure has been dominant in the recent trading sessions.
- Chaikin Money Flow (CMF): The CMF is negative, suggesting that money is flowing out of the stock.
Key Observations and Opinions:
- Trend: The stock is currently in a consolidation phase with no clear trend direction.
- Momentum: The momentum indicators suggest a potential reversal or a short-term bounce in the stock price.
- Volatility: The narrowing Bollinger Bands indicate a period of low volatility, which may precede a breakout.
- Volume: The declining OBV and negative CMF indicate bearish sentiment and selling pressure in the stock.
Conclusion:
Based on the analysis of the technical indicators, the stock is likely to experience sideways movement in the next few days with a potential for a short-term bounce due to the oversold conditions indicated by the momentum indicators. However, the overall trend remains neutral with a slight bearish bias, as reflected in the volume and volatility indicators. Traders should exercise caution and wait for a clearer trend to emerge before making significant trading decisions.