Technical Analysis of ASPS 2024-05-10
Overview:
In analyzing the technical indicators for ASPS over the last 5 days, we will delve into the trend, momentum, volatility, and volume indicators to provide a comprehensive assessment of the stock's potential price movement. By examining these key factors, we aim to offer valuable insights and predictions for the next few days.
Trend Analysis:
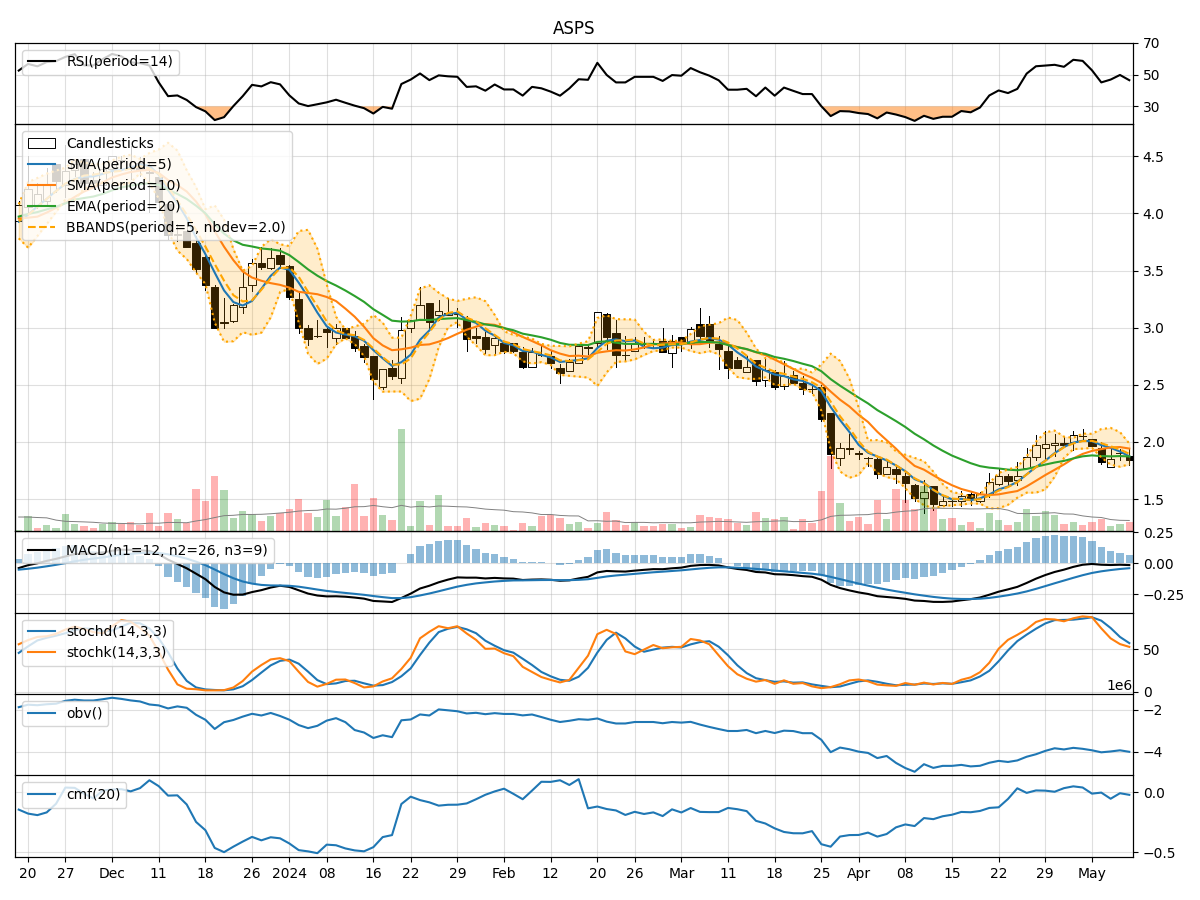
- Moving Averages (MA): The 5-day MA has been consistently below the closing price, indicating a short-term downtrend.
- MACD: The MACD line has been negative, suggesting bearish momentum in the stock.
- EMA: The EMA has been declining, further supporting the bearish trend.
Key Observation: The trend indicators point towards a downward trajectory for ASPS.
Momentum Analysis:
- RSI: The RSI has been fluctuating around the 50 level, indicating a lack of strong momentum in either direction.
- Stochastic Oscillator: Both %K and %D have been trending downwards, signaling weakening momentum.
- Williams %R: The indicator has been hovering in the oversold territory, suggesting a potential reversal.
Key Observation: Momentum indicators reflect a neutral to bearish sentiment for ASPS.
Volatility Analysis:
- Bollinger Bands: The stock price has been trading below the lower Bollinger Band, indicating oversold conditions.
- Bollinger %B: The %B value has been below 0.2, signaling potential undervaluation.
- Average True Range (ATR): ATR has been relatively low, indicating decreased volatility.
Key Observation: Volatility indicators suggest a potential reversal or consolidation in the stock price.
Volume Analysis:
- On-Balance Volume (OBV): The OBV has been declining, indicating selling pressure in the stock.
- Chaikin Money Flow (CMF): The CMF has been negative, suggesting outflow of money from the stock.
Key Observation: Volume indicators point towards bearish sentiment in ASPS.
Conclusion:
Based on the analysis of trend, momentum, volatility, and volume indicators, the overall outlook for ASPS in the next few days is bearish. The stock is likely to continue its downward trend, supported by the negative momentum and volume indicators. However, the low volatility and oversold conditions indicated by the Bollinger Bands may lead to a potential consolidation before any significant price movement.
Recommendation: It is advisable to exercise caution and closely monitor the stock's price action for any signs of a reversal or confirmation of the bearish trend. Consider setting stop-loss levels and wait for more definitive signals before making any trading decisions.