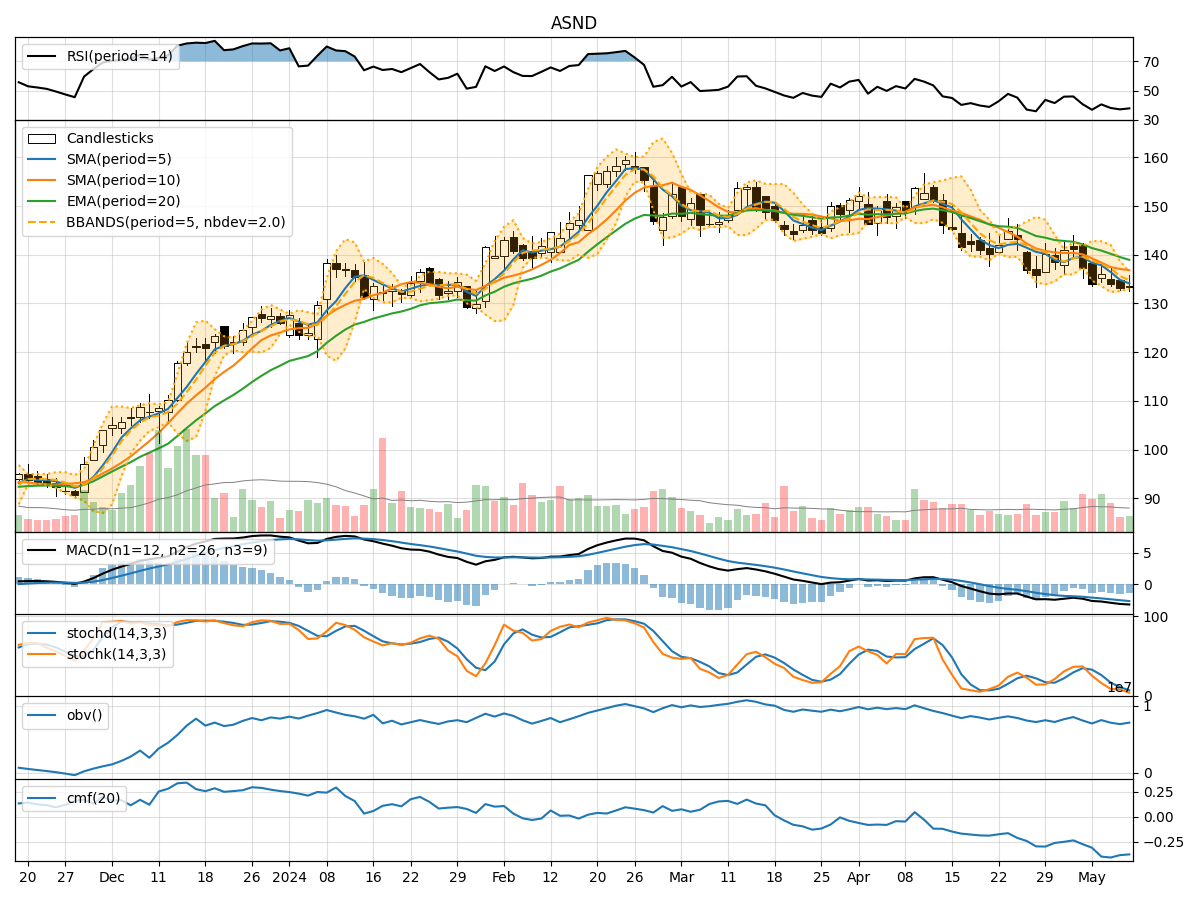
Technical Analysis of ASND 2024-05-10
Overview:
In analyzing the technical indicators for ASND over the last 5 days, we will delve into the trend, momentum, volatility, and volume indicators to provide a comprehensive outlook on the possible stock price movement in the coming days.
Trend Analysis:
- Moving Averages (MA): The 5-day MA has been consistently below the closing price, indicating a short-term downtrend.
- MACD: The MACD line has been consistently below the signal line, suggesting a bearish momentum.
- EMA: The exponential moving average has been trending downwards, reflecting a weakening trend.
Key Observation: The trend indicators point towards a bearish sentiment in the stock price movement.
Momentum Analysis:
- RSI: The Relative Strength Index has been hovering around the oversold territory, indicating a potential reversal or continuation of the downtrend.
- Stochastic Oscillator: Both %K and %D have been in the oversold region, signaling a potential reversal in the near future.
- Williams %R: The indicator has been consistently in the oversold territory, suggesting a possible bounce back.
Key Observation: Momentum indicators suggest a possible reversal or consolidation in the stock price movement.
Volatility Analysis:
- Bollinger Bands: The stock price has been trading below the lower Bollinger Band, indicating oversold conditions.
- Bollinger Band Width: The band width has been narrowing, suggesting a decrease in volatility.
- Bollinger Band %B: The %B indicator is below 0.2, indicating an oversold condition.
Key Observation: Volatility indicators signal a potential reversal or consolidation in the stock price.
Volume Analysis:
- On-Balance Volume (OBV): The OBV has been declining, indicating selling pressure in the stock.
- Chaikin Money Flow (CMF): The CMF has been negative, suggesting outflow of money from the stock.
Key Observation: Volume indicators support the bearish sentiment in the stock price movement.
Conclusion:
Based on the analysis of trend, momentum, volatility, and volume indicators, the overall outlook for ASND in the next few days is bearish. The stock is likely to experience further downside movement or consolidation before any potential reversal. Traders should exercise caution and consider shorting or staying on the sidelines until a clear trend reversal is confirmed.
Key Conclusion:
- Bearish View: The technical indicators collectively suggest a bearish outlook for ASND in the near term.
- Consolidation: There might be a period of consolidation before a potential reversal.
- Caution Advised: Traders should be cautious and wait for confirmation of a trend reversal before considering long positions.
Remember, market dynamics can change rapidly, so it's essential to monitor the indicators closely for any shifts in the stock's price movement.