Technical Analysis of ASLN 2024-05-10
Overview:
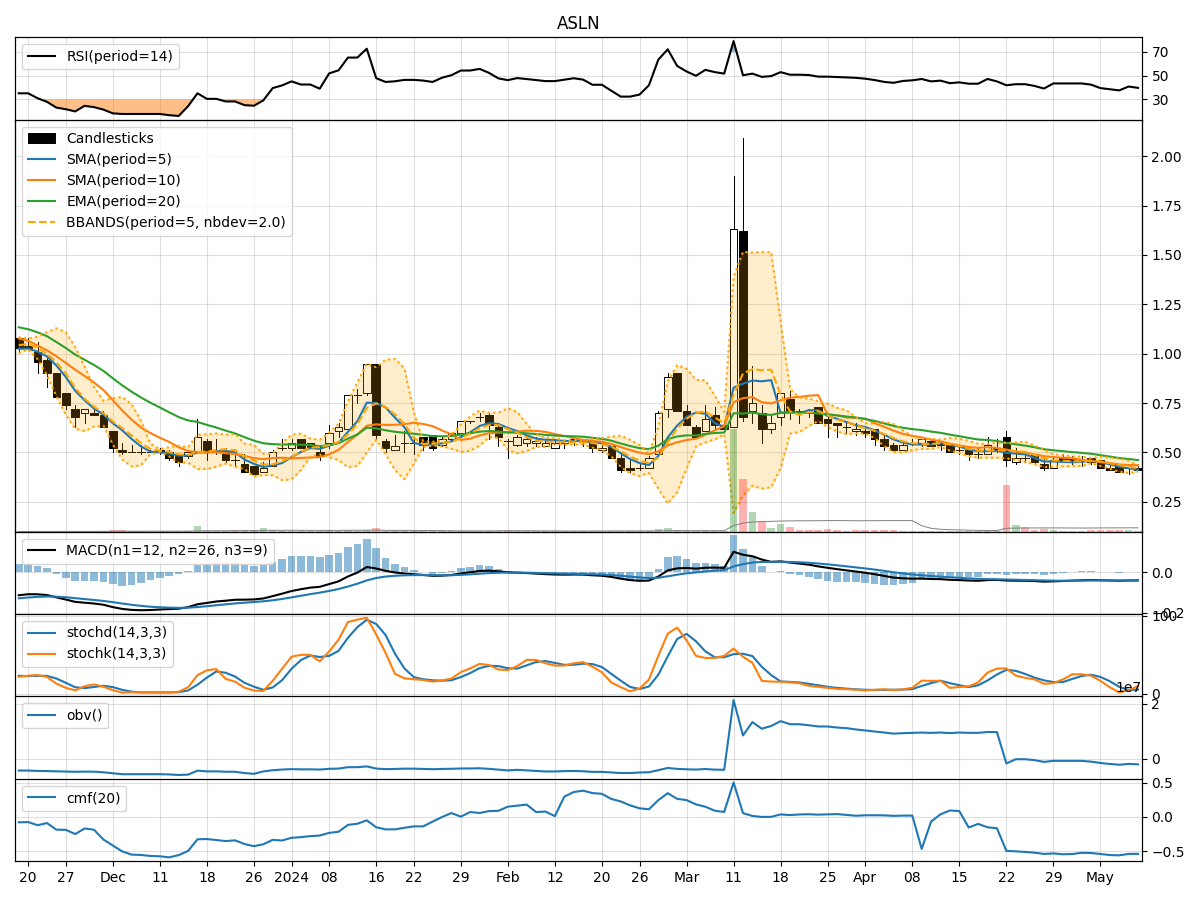
In analyzing the technical indicators for ASLN over the last 5 days, we will delve into the trend, momentum, volatility, and volume indicators to provide a comprehensive outlook on the possible stock price movement in the coming days.
Trend Analysis:
- Moving Averages (MA): The 5-day MA has been consistently decreasing, indicating a downward trend in the stock price.
- MACD: The MACD line has been negative, with the MACD histogram also showing a downward trend.
Key Observation: The stock is currently in a downtrend based on the moving averages and MACD indicators.
Momentum Analysis:
- RSI: The RSI has been fluctuating around the oversold region, suggesting a lack of strong momentum in either direction.
- Stochastic Oscillator: Both %K and %D have been relatively low, indicating a lack of strong buying or selling pressure.
Key Observation: Momentum indicators suggest a sideways movement or lack of clear direction in the stock price.
Volatility Analysis:
- Bollinger Bands (BB): The stock price has been trading below the lower Bollinger Band, indicating oversold conditions.
Key Observation: Volatility indicators suggest a potential reversal or a temporary bottom in the stock price.
Volume Analysis:
- On-Balance Volume (OBV): The OBV has been fluctuating, indicating mixed buying and selling pressure.
- Chaikin Money Flow (CMF): The CMF has been negative, suggesting a net outflow of money from the stock.
Key Observation: Volume indicators suggest mixed sentiment among market participants.
Conclusion:
Based on the analysis of the technical indicators, the stock of ASLN is currently in a downtrend with sideways momentum and mixed volume sentiment. However, the volatility indicators hint at a potential reversal or temporary bottom in the stock price.
Forecast:
Considering the overall technical picture, the next few days may see the stock price of ASLN experiencing further downside pressure in the short term. Traders and investors should exercise caution and wait for clearer signals before considering any long positions.