Technical Analysis of ARGX 2024-05-10
Overview:
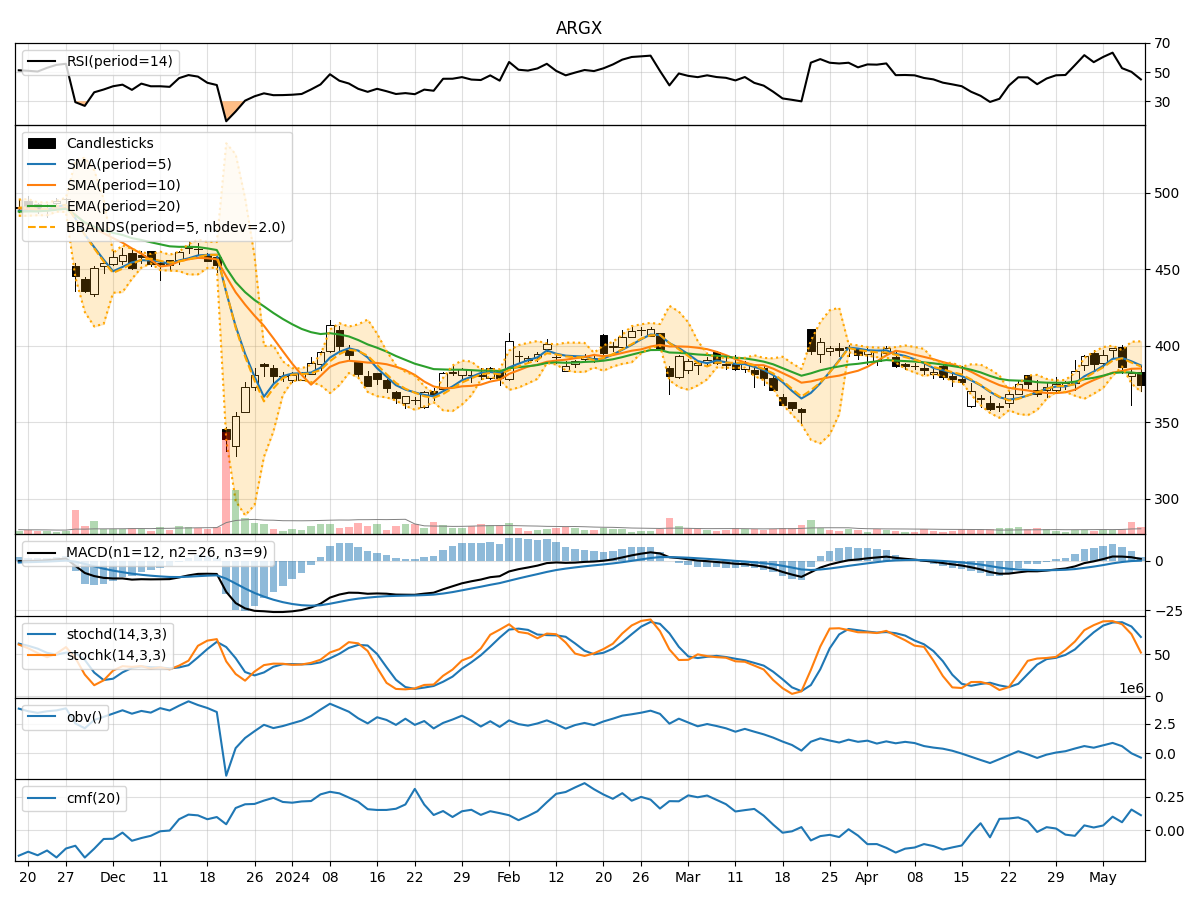
In analyzing the technical indicators for ARGX over the last 5 days, we will delve into the trend, momentum, volatility, and volume indicators to provide a comprehensive outlook on the possible stock price movement in the coming days. By examining these key aspects, we aim to offer valuable insights and predictions for potential investors.
Trend Analysis:
- Moving Averages (MA): The 5-day Moving Average (MA) has been fluctuating around the Simple Moving Average (SMA) and Exponential Moving Average (EMA) values, indicating a lack of clear trend direction.
- MACD: The Moving Average Convergence Divergence (MACD) has shown some positive values but with decreasing momentum, suggesting a weakening bullish trend.
- Conclusion: The trend indicators suggest a sideways movement with a slight bearish bias.
Momentum Analysis:
- RSI: The Relative Strength Index (RSI) has been declining, indicating a loss of bullish momentum.
- Stochastic Oscillator: Both %K and %D values have been decreasing, signaling a potential shift towards oversold conditions.
- Conclusion: The momentum indicators point towards a weakening bullish momentum and a possible shift towards bearish sentiment.
Volatility Analysis:
- Bollinger Bands (BB): The Bollinger Bands have been narrowing, suggesting decreasing volatility in the stock price.
- Conclusion: The volatility indicators indicate a decreasing volatility environment, potentially leading to a period of consolidation.
Volume Analysis:
- On-Balance Volume (OBV): The OBV has been consistently negative, indicating selling pressure in the stock.
- Chaikin Money Flow (CMF): The CMF has shown a slight increase but remains relatively low, reflecting a lack of strong buying interest.
- Conclusion: The volume indicators highlight selling pressure and a lack of significant buying activity.
Overall Conclusion:
Based on the analysis of trend, momentum, volatility, and volume indicators, the next few days for ARGX are likely to see a sideways movement with a bearish bias. The weakening bullish momentum, decreasing volatility, and selling pressure indicated by the technical indicators suggest that the stock may face challenges in sustaining an upward trend. Investors should exercise caution and consider waiting for more clarity in the market dynamics before making significant investment decisions.
Key Recommendations:
- Monitor Price Action: Keep a close eye on the stock price movement for any signs of a breakout or breakdown from the current sideways pattern.
- Wait for Confirmation: Wait for confirmation from multiple indicators before making any trading decisions to reduce risk.
- Consider Risk Management: Implement proper risk management strategies to protect your investment in case of unexpected price movements.
By staying informed and utilizing technical analysis tools effectively, investors can navigate the market dynamics and make well-informed decisions aligned with their investment goals and risk tolerance levels.