Technical Analysis of APXI 2024-05-10
Overview:
In analyzing the technical indicators for APXI over the last 5 days, we will delve into the trend, momentum, volatility, and volume indicators to provide a comprehensive outlook on the possible stock price movement in the coming days. By examining these key aspects, we aim to offer valuable insights and predictions to guide investment decisions.
Trend Indicators:
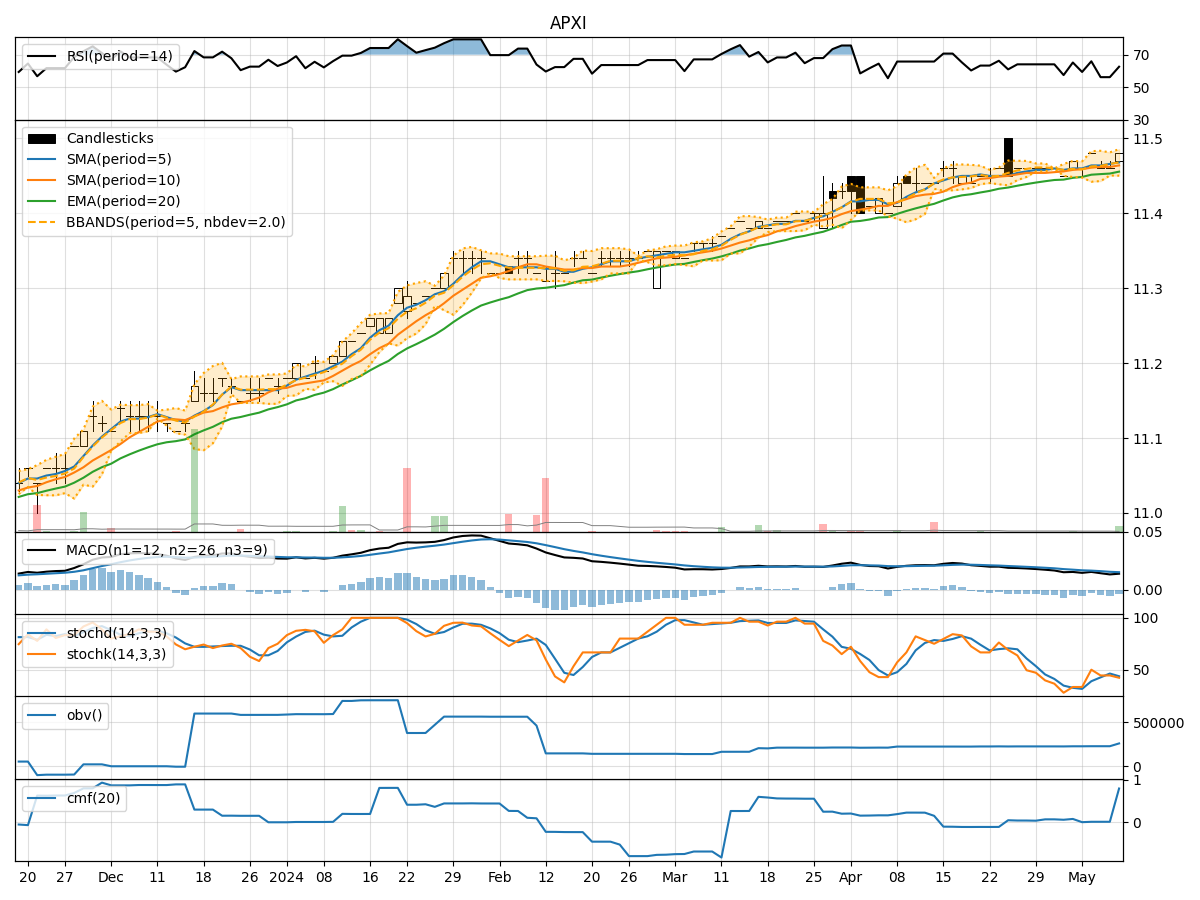
- Moving Averages (MA): The 5-day moving average has been relatively stable around the current stock price, indicating a neutral trend.
- MACD: The MACD line has been consistently positive, suggesting a bullish momentum in the short term.
- RSI: The RSI has been fluctuating around the neutral zone, indicating a lack of strong trend direction.
Momentum Indicators:
- Stochastic Oscillator: The stochastic indicators have shown mixed signals, with no clear overbought or oversold conditions.
- Williams %R (WillR): The Williams %R has been hovering around the oversold territory, indicating a potential buying opportunity.
Volatility Indicators:
- Bollinger Bands (BB): The Bollinger Bands have shown a slight widening, suggesting increased volatility in the stock price.
- BB% (BB Percentage): The BB% has fluctuated within a moderate range, indicating moderate price volatility.
Volume Indicators:
- On-Balance Volume (OBV): The OBV has shown a slight decrease, indicating some selling pressure in the stock.
- Chaikin Money Flow (CMF): The CMF has been positive, suggesting a bullish money flow into the stock.
Key Observations:
- The trend indicators suggest a neutral stance with a slight bullish bias based on the MACD.
- Momentum indicators show mixed signals, with potential buying opportunities indicated by the Williams %R.
- Volatility indicators point towards a moderate increase in price volatility.
- Volume indicators reflect a slight decrease in buying pressure but overall positive money flow into the stock.
Conclusion:
Based on the analysis of the technical indicators, the stock price of APXI is likely to experience sideways movement in the coming days with a slight bullish bias. Traders may consider buying opportunities indicated by the Williams %R, while also being cautious of the increased volatility suggested by the Bollinger Bands. Overall, a neutral to slightly bullish outlook is recommended for the next few days.