Technical Analysis of APWC 2024-05-10
Overview:
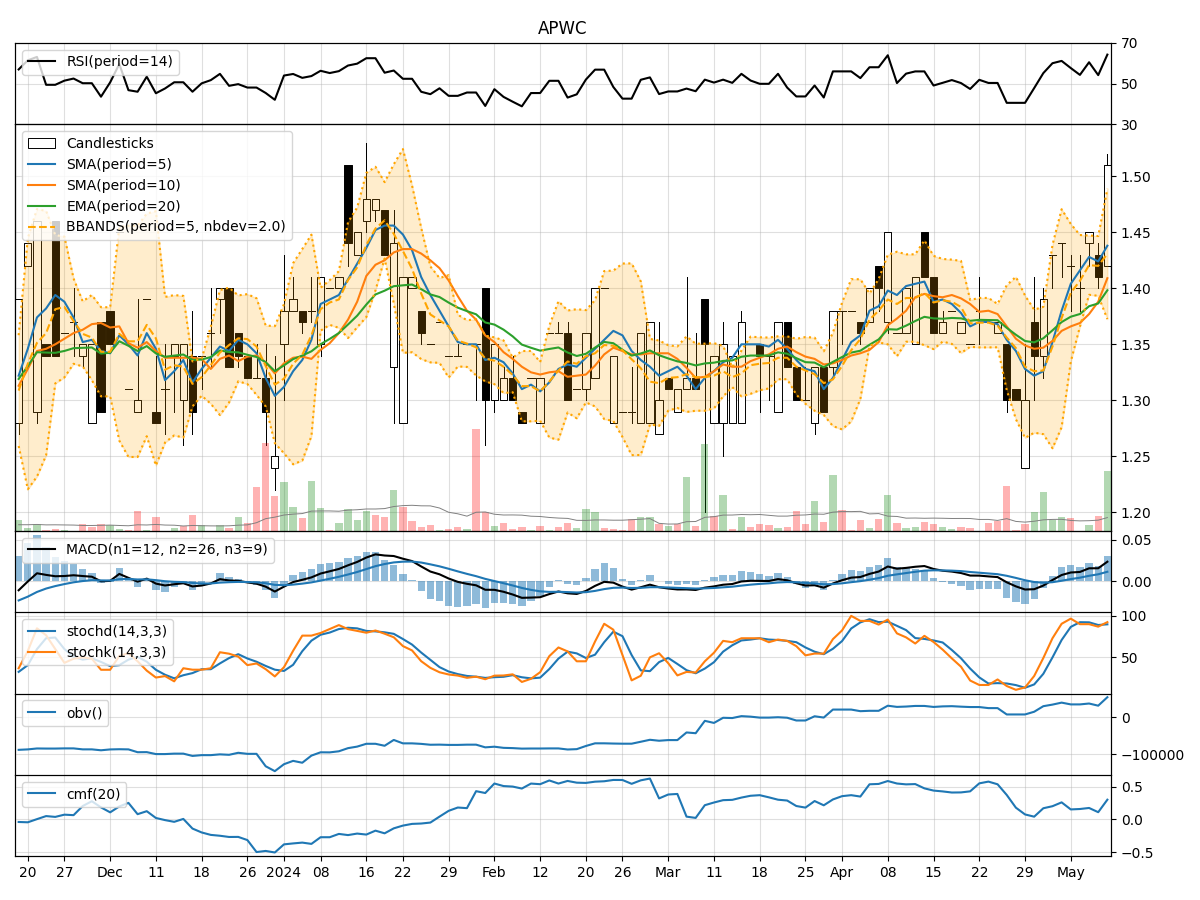
In analyzing the technical indicators for APWC over the last 5 days, we will delve into the trend, momentum, volatility, and volume indicators to provide a comprehensive outlook on the possible stock price movement in the coming days. By examining these key aspects, we aim to offer valuable insights and predictions to guide investment decisions.
Trend Analysis:
- Moving Averages (MA): The 5-day Moving Average (MA) has been trending upwards, indicating a positive momentum in the stock price.
- MACD: The Moving Average Convergence Divergence (MACD) shows an increasing positive value, suggesting a strengthening bullish trend.
- EMA: The Exponential Moving Average (EMA) has been consistently rising, reflecting a bullish sentiment in the market.
Momentum Analysis:
- RSI: The Relative Strength Index (RSI) is in the neutral zone, indicating a balanced momentum in the stock.
- Stochastic Oscillator: Both %K and %D values are relatively high, signaling a potential overbought condition.
- Williams %R: The Williams %R is in the oversold territory, suggesting a possible reversal in the short term.
Volatility Analysis:
- Bollinger Bands: The Bollinger Bands are widening, indicating increased volatility in the stock price.
- Bollinger %B: The %B value is above 0.8, suggesting the stock is trading near the upper band, potentially overbought.
Volume Analysis:
- On-Balance Volume (OBV): The OBV has been fluctuating, indicating mixed buying and selling pressure.
- Chaikin Money Flow (CMF): The CMF value is positive but not significantly high, suggesting moderate buying pressure.
Conclusion:
Based on the analysis of the technical indicators, the stock of APWC is bullish in the short term. The positive trend in moving averages, increasing MACD values, and rising EMA indicate a potential upward movement in the stock price. However, caution is advised as the stochastic oscillator shows overbought conditions, and the Williams %R indicates a possible reversal. The widening Bollinger Bands suggest increased volatility, while the OBV and CMF reflect mixed sentiment in terms of volume.
Recommendation:
Considering the overall bullish trend but with caution due to overbought signals, investors may consider taking partial profits or setting tight stop-loss orders to manage risk. Monitoring the stock closely for any signs of reversal or consolidation is advisable. Additionally, conducting further research and staying updated on market developments can help in making informed investment decisions.