Technical Analysis of APVO 2024-05-31
Overview:
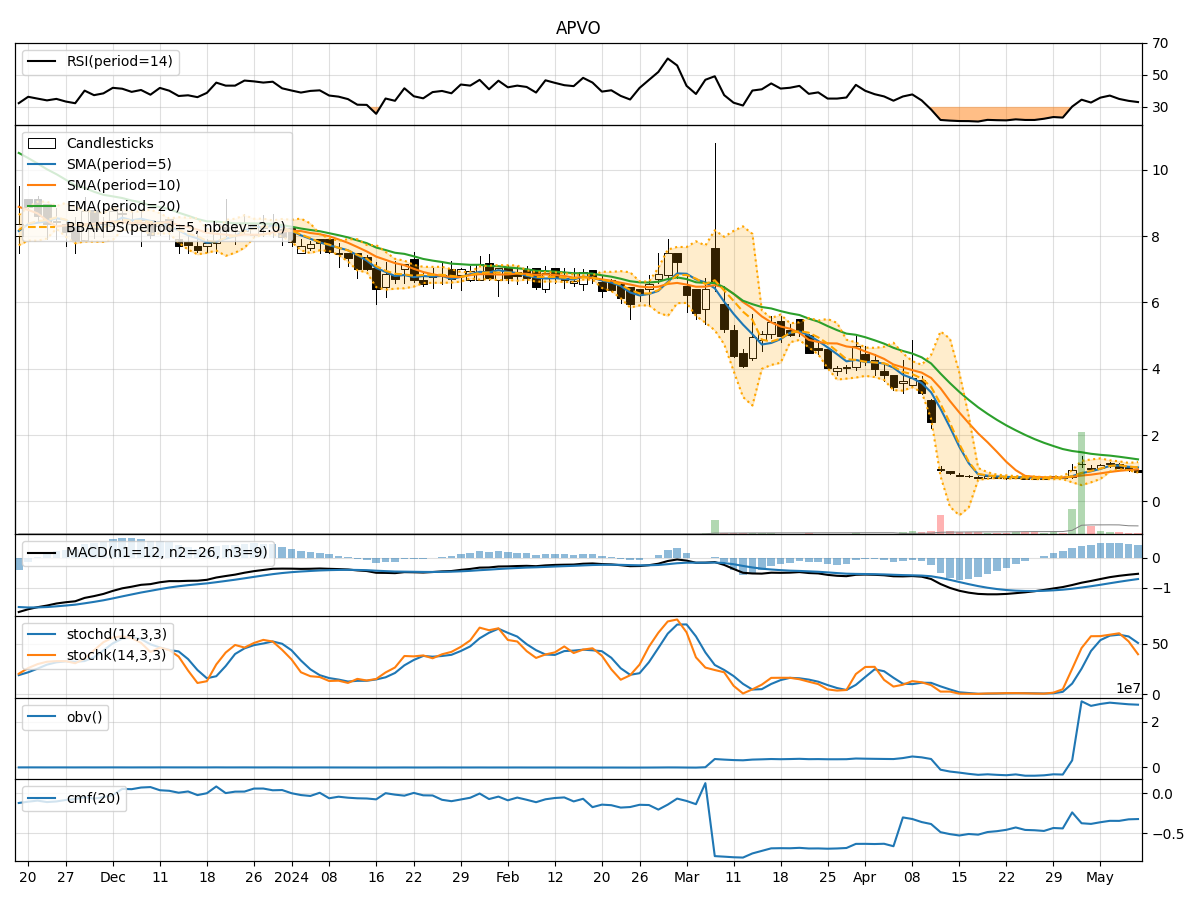
In analyzing the technical indicators for APVO over the last 5 days, we will delve into the trend, momentum, volatility, and volume indicators to provide a comprehensive assessment of the stock's potential price movement. By examining these key factors, we aim to offer insights and predictions for the next few days.
Trend Analysis:
- Moving Averages (MA): The 5-day MA has been consistently below the closing price, indicating a downward trend.
- MACD: The MACD line has been negative, suggesting bearish momentum in the stock.
- EMA: The exponential moving average has been declining, further supporting the bearish trend.
Key Observation: The trend indicators point towards a downward trajectory for APVO.
Momentum Analysis:
- RSI: The Relative Strength Index has been below 50, indicating bearish momentum.
- Stochastic Oscillator: Both %K and %D have been trending downwards, signaling weakening momentum.
- Williams %R: The indicator has been in oversold territory, suggesting a potential reversal.
Key Observation: Momentum indicators reflect a bearish sentiment for APVO.
Volatility Analysis:
- Bollinger Bands: The stock price has been trading below the lower Bollinger Band, indicating oversold conditions.
- Bollinger %B: The %B indicator has been below 0.2, signaling potential undervaluation.
- Volatility: Volatility has been decreasing, suggesting a possible stabilization in price movement.
Key Observation: Volatility indicators imply a potential reversal or consolidation in APVO's price.
Volume Analysis:
- On-Balance Volume (OBV): The OBV has been relatively flat, indicating a lack of strong buying or selling pressure.
- Chaikin Money Flow (CMF): The CMF has been negative, suggesting outflow of money from the stock.
Key Observation: Volume indicators show neutral sentiment with a slight bearish bias.
Conclusion:
Based on the analysis of trend, momentum, volatility, and volume indicators, the overall outlook for APVO in the next few days appears bearish. The stock is likely to continue its downward trend, supported by negative momentum and lackluster volume activity. However, the decreasing volatility and potential oversold conditions indicated by the Bollinger Bands may lead to a temporary consolidation or reversal in the near term.
Key Conclusion: The next few days for APVO are likely to see further downside with a possibility of temporary consolidation before a potential reversal. Investors should exercise caution and consider waiting for clearer signals before making trading decisions.