Technical Analysis of AMZN 2024-05-10
Overview:
In analyzing the technical indicators for AMZN over the last 5 days, we will delve into the trend, momentum, volatility, and volume indicators to provide a comprehensive outlook on the possible stock price movement. By examining these key factors, we aim to offer valuable insights and predictions for the upcoming days.
Trend Indicators:
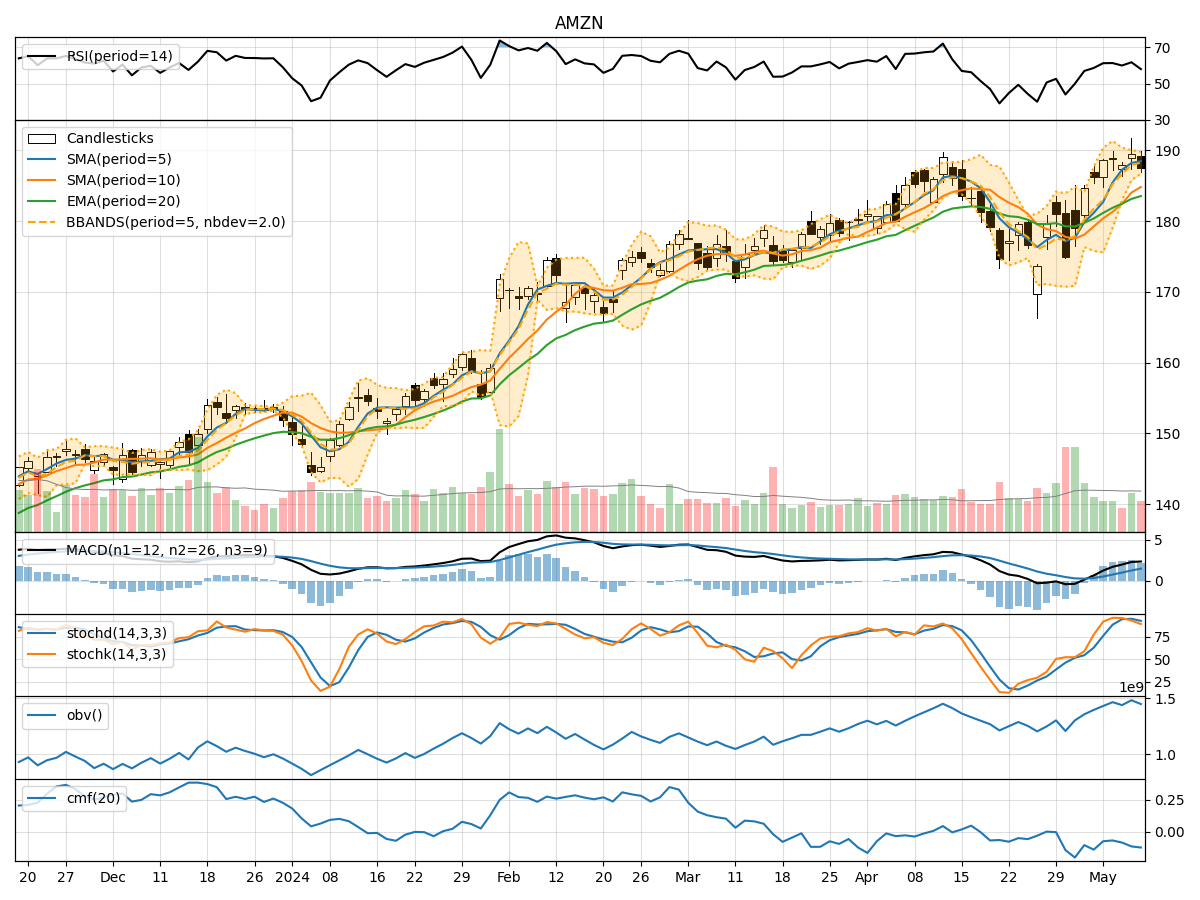
- Moving Averages (MA): The 5-day moving average has been consistently above the simple moving average (SMA) and exponential moving average (EMA), indicating a bullish trend.
- MACD: The MACD line has been consistently above the signal line, with both lines showing an upward trend, suggesting bullish momentum.
- Conclusion: The trend indicators point towards an upward movement in the stock price.
Momentum Indicators:
- RSI: The Relative Strength Index (RSI) has been fluctuating around the 60-65 range, indicating moderate momentum.
- Stochastic Oscillator: Both %K and %D have been gradually decreasing but remain in the overbought territory, suggesting a potential reversal.
- Conclusion: Momentum indicators suggest a potential consolidation or slight pullback in the stock price.
Volatility Indicators:
- Bollinger Bands: The stock price has been trading within the Bollinger Bands, with the bands narrowing, indicating decreasing volatility.
- Conclusion: Volatility indicators signal a potential decrease in volatility and a consolidation phase.
Volume Indicators:
- On-Balance Volume (OBV): The OBV has been fluctuating but generally showing a slight decrease, indicating some distribution.
- Chaikin Money Flow (CMF): The CMF has been negative, suggesting selling pressure in the stock.
- Conclusion: Volume indicators imply a slight bearish sentiment in the stock.
Overall Conclusion:
Based on the analysis of trend, momentum, volatility, and volume indicators, the next few days for AMZN are likely to see a consolidation phase with a potential slight pullback in the stock price. While the trend indicators remain bullish, momentum indicators suggest a possible consolidation or pullback. Volatility is expected to decrease, indicating a period of stability, and volume indicators point towards a slight bearish sentiment.
Recommendation:
- Short-term Traders: Consider taking profits or tightening stop-loss levels during the consolidation phase.
- Long-term Investors: Use the potential pullback as an opportunity to accumulate more shares at a better price.
- Risk Management: Monitor key support and resistance levels closely to adjust trading strategies accordingly.
Disclaimer:
Remember that market conditions can change rapidly, and unexpected events can impact stock prices. It is essential to conduct thorough research and consider multiple factors before making any investment decisions. Consulting with a financial advisor can provide personalized guidance tailored to your specific investment goals and risk tolerance.