Technical Analysis of AMGN 2024-05-10
Overview:
In analyzing the technical indicators for AMGN over the last 5 days, we will delve into the trend, momentum, volatility, and volume indicators to provide a comprehensive outlook on the possible stock price movement in the coming days. By examining these key aspects, we aim to offer valuable insights and predictions for informed decision-making.
Trend Analysis:
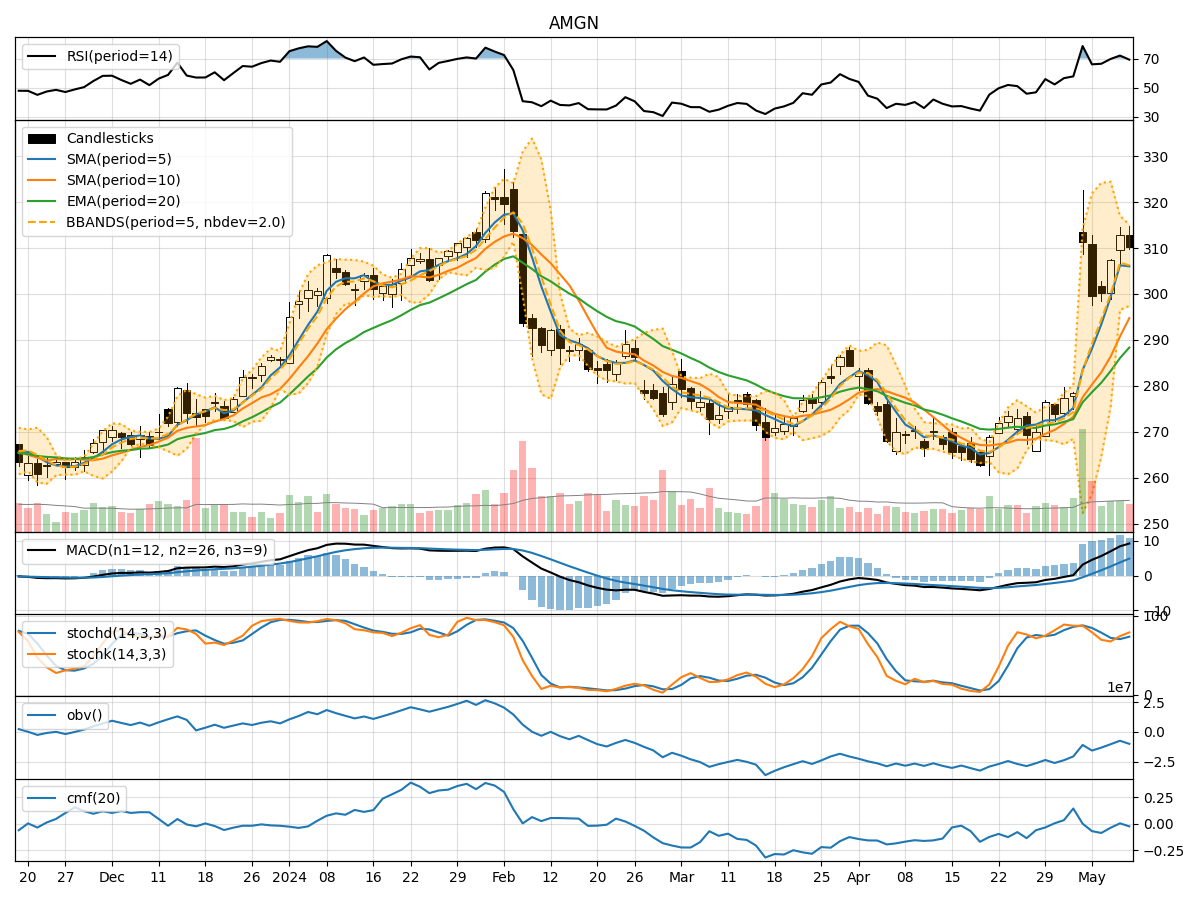
- Moving Averages (MA): The 5-day Moving Average (MA) has been consistently above the Simple Moving Average (SMA) and Exponential Moving Average (EMA), indicating a bullish trend.
- MACD: The Moving Average Convergence Divergence (MACD) has shown an increasing trend, with the MACD line consistently above the signal line, suggesting bullish momentum.
Momentum Analysis:
- RSI: The Relative Strength Index (RSI) has been in the overbought territory, indicating a strong bullish momentum.
- Stochastic Oscillator: Both %K and %D have been in the overbought zone, signaling a potential reversal or consolidation.
Volatility Analysis:
- Bollinger Bands (BB): The Bollinger Bands have shown a narrowing range, indicating decreasing volatility and a possible period of consolidation.
Volume Analysis:
- On-Balance Volume (OBV): The OBV has been fluctuating, suggesting indecision among investors regarding the stock.
- Chaikin Money Flow (CMF): The CMF has been negative, indicating selling pressure in the market.
Key Observations:
- The trend indicators suggest a strong bullish sentiment in the short term.
- Momentum indicators point towards a potential overbought scenario, signaling a need for caution.
- Volatility indicators indicate a period of consolidation or a potential decrease in price fluctuations.
- Volume indicators reflect mixed signals, with no clear direction in investor sentiment.
Conclusion:
Based on the analysis of the technical indicators, the next few days for AMGN could see a continuation of the bullish trend in the short term. However, given the overbought signals from the momentum indicators and the mixed signals from volume indicators, there might be a possibility of a minor pullback or consolidation before any further upward movement. Traders should closely monitor key support and resistance levels to make informed trading decisions.
Recommendation:
- Short-term Traders: Consider taking profits on existing positions or tightening stop-loss levels to protect gains.
- Long-term Investors: Monitor the price action for potential entry points during any pullback for a more favorable risk-reward ratio.
By combining technical analysis with market insights, investors can navigate the dynamic landscape of the stock market effectively and make well-informed decisions aligned with their investment goals.