Technical Analysis of AMD 2024-05-03
Overview:
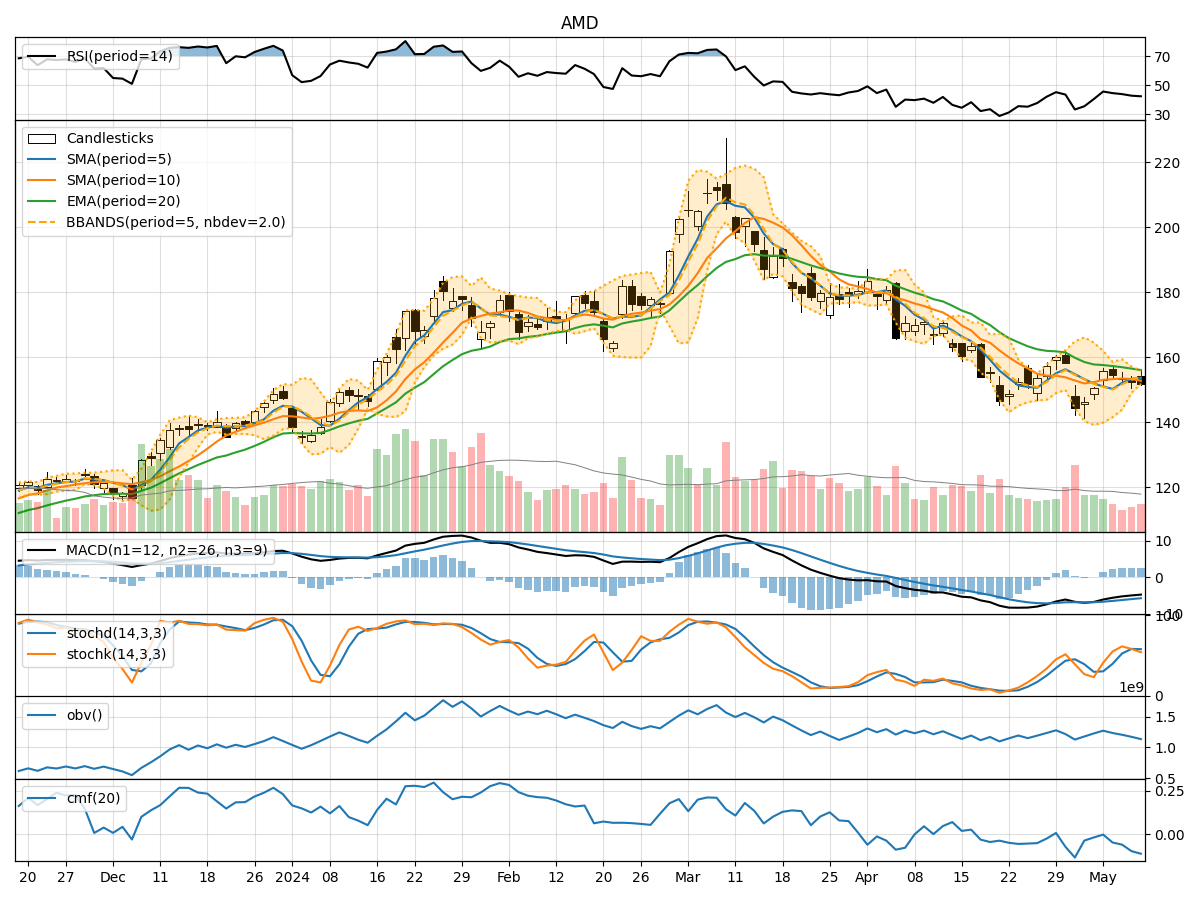
In analyzing the technical indicators for AMD over the last 5 days, we will delve into the trend, momentum, volatility, and volume indicators to provide a comprehensive outlook on the possible stock price movement in the coming days.
Trend Analysis:
- Moving Averages (MA): The 5-day Moving Average (MA) has been fluctuating around the Simple Moving Average (SMA) and Exponential Moving Average (EMA) values, indicating a lack of clear trend direction.
- MACD: The Moving Average Convergence Divergence (MACD) has been consistently negative, suggesting a bearish momentum in the short term.
Momentum Analysis:
- RSI: The Relative Strength Index (RSI) has been hovering around the mid-range, indicating a neutral momentum.
- Stochastic Oscillator: Both %K and %D values have been declining, signaling a bearish momentum.
- Williams %R: The Williams %R is in oversold territory, suggesting a potential reversal or bounce.
Volatility Analysis:
- Bollinger Bands: The Bollinger Bands have been narrowing, indicating decreasing volatility in the stock price.
- Bollinger %B: The %B value has been fluctuating around the mid-range, reflecting a lack of extreme price movements.
Volume Analysis:
- On-Balance Volume (OBV): The OBV has been consistently negative, indicating selling pressure in the stock.
- Chaikin Money Flow (CMF): The CMF has been declining, suggesting outflow of money from the stock.
Key Observations and Opinions:
- Trend: The lack of clear trend direction in the moving averages and the consistently negative MACD signal a bearish bias in the short term.
- Momentum: The mixed signals from RSI and the bearish stance of the Stochastic Oscillator point towards a potential downward movement.
- Volatility: The decreasing volatility as indicated by the narrowing Bollinger Bands may lead to a period of consolidation or sideways movement.
- Volume: The negative OBV and declining CMF highlight the selling pressure and the lack of buying interest in the stock.
Conclusion:
Based on the analysis of the technical indicators, the next few days for AMD stock price movement are likely to be downward. The bearish momentum indicated by the MACD, Stochastic Oscillator, and overall negative volume indicators suggest a potential continuation of the current downward trend. Traders and investors should exercise caution and consider short-term bearish strategies or wait for a clearer trend reversal signal before considering long positions.