Technical Analysis of AMAT 2024-05-10
Overview:
In analyzing the technical indicators for AMAT over the last 5 days, we will delve into the trend, momentum, volatility, and volume indicators to provide a comprehensive outlook on the possible stock price movement. By examining these key aspects, we aim to offer valuable insights and predictions for the upcoming days.
Trend Indicators:
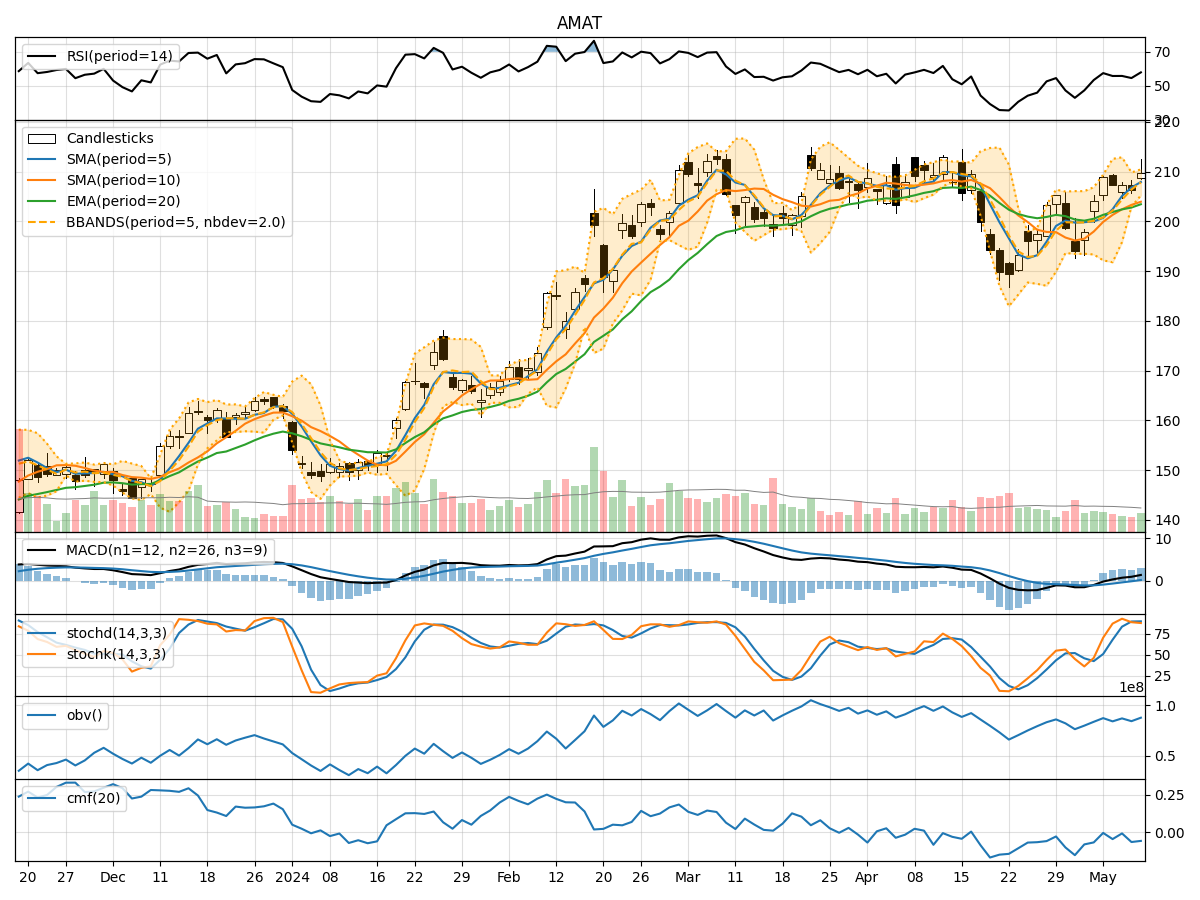
- Moving Averages (MA): The 5-day moving average has been consistently above the simple moving average (SMA) and exponential moving average (EMA), indicating a bullish trend.
- MACD: The MACD line has been consistently above the signal line, with both showing an upward trend, suggesting bullish momentum.
- MACD Histogram: The MACD histogram has been increasing over the last 5 days, indicating strengthening bullish momentum.
Momentum Indicators:
- RSI: The Relative Strength Index (RSI) has been fluctuating around the 50 level, indicating a neutral momentum.
- Stochastic Oscillator: Both %K and %D have been in the overbought zone, suggesting a potential reversal or consolidation.
- Williams %R: The Williams %R is hovering around oversold levels, indicating a potential buying opportunity.
Volatility Indicators:
- Bollinger Bands: The stock price has been trading within the Bollinger Bands, with the bands narrowing, suggesting a period of consolidation.
- Bollinger %B: The %B indicator is fluctuating around the midline, indicating a balanced market sentiment.
Volume Indicators:
- On-Balance Volume (OBV): The OBV has been fluctuating, indicating indecision among market participants.
- Chaikin Money Flow (CMF): The CMF has been negative, suggesting selling pressure in the market.
Key Observations and Opinions:
- Trend: The trend indicators suggest a strong bullish sentiment in the short term.
- Momentum: The momentum indicators show mixed signals, with potential for a reversal or consolidation.
- Volatility: Volatility indicators point towards a period of consolidation or sideways movement.
- Volume: Volume indicators reflect indecision among traders, with selling pressure evident.
Conclusion:
Based on the analysis of the technical indicators, the next few days for AMAT could see sideways movement or consolidation as the stock price may trade within a narrow range. Traders should exercise caution and wait for clearer signals before taking significant positions. The overall outlook remains neutral to slightly bearish in the short term, with a potential for a reversal if key support levels are breached.