Technical Analysis of ALOT 2024-05-31
Overview:
In analyzing the technical indicators for the stock over the last 5 days, we will delve into the trend, momentum, volatility, and volume indicators to provide a comprehensive outlook on the possible future stock price movement. By examining these key aspects, we aim to offer valuable insights and predictions for the upcoming trading days.
Trend Indicators:
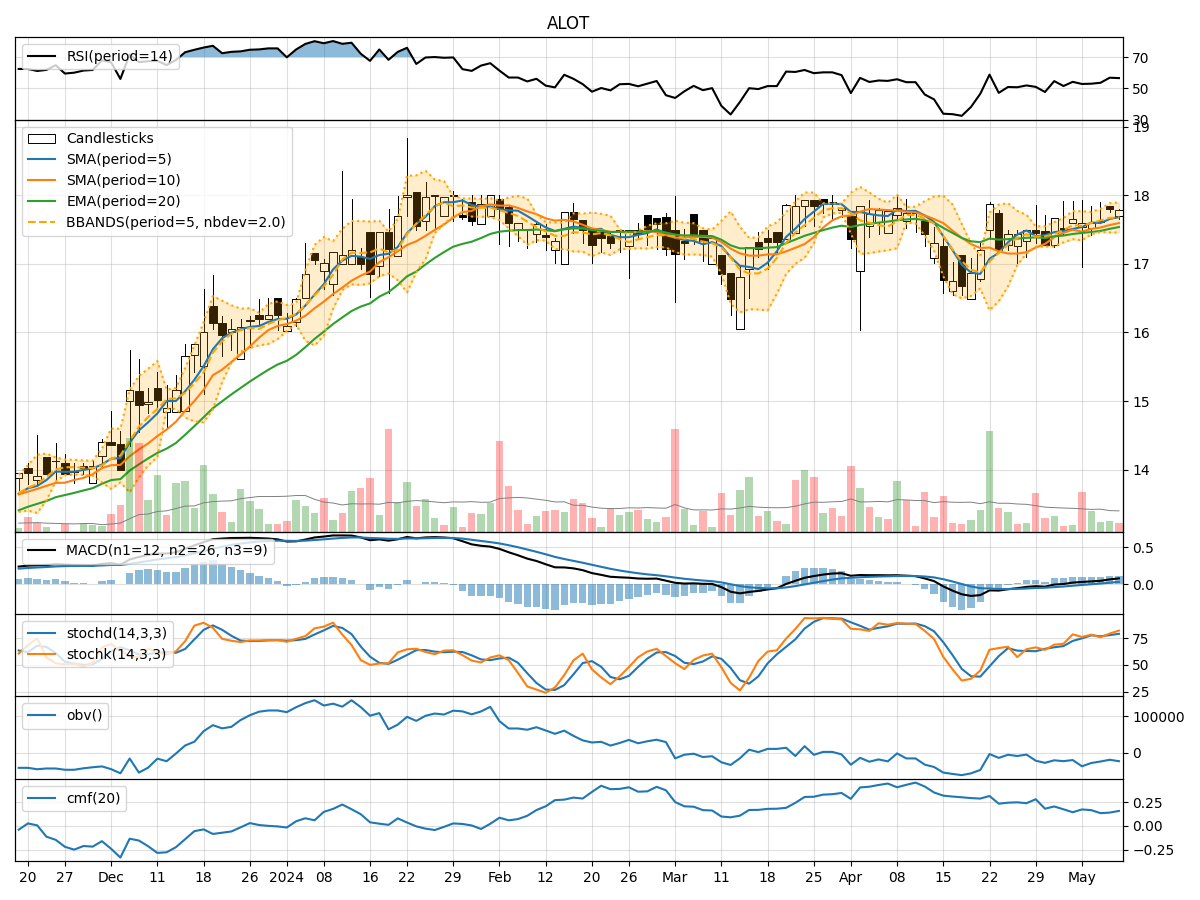
- Moving Averages (MA): The stock's closing prices have been consistently above the 5-day moving average, indicating a short-term uptrend.
- MACD: The MACD line has been consistently above the signal line, with increasing values, suggesting a strengthening bullish momentum.
- EMA: The exponential moving average has been trending upwards, reflecting a positive price trend.
Momentum Indicators:
- RSI: The Relative Strength Index has been hovering around the neutral zone, indicating a balanced momentum without extreme overbought or oversold conditions.
- Stochastic Oscillator: Both %K and %D have been in the overbought territory, suggesting a potential near-term reversal or consolidation.
- Williams %R: The Williams %R is also in the overbought region, signaling a possible pullback in the stock price.
Volatility Indicators:
- Bollinger Bands: The stock price has been trading within the upper Bollinger Band, indicating an overbought condition and a potential reversal or consolidation.
- Bollinger %B: The %B indicator is above 0.8, suggesting a high volatility period and a probable price correction.
Volume Indicators:
- On-Balance Volume (OBV): The OBV has been fluctuating, indicating mixed buying and selling pressure in the stock.
- Chaikin Money Flow (CMF): The CMF has been negative, reflecting a lack of strong buying interest in the stock.
Key Observations:
- The trend indicators suggest a bullish sentiment in the short term, supported by the moving averages and MACD.
- Momentum indicators show signs of potential overbought conditions, indicating a possible reversal or consolidation.
- Volatility indicators point towards high volatility and a likelihood of a price correction.
- Volume indicators reflect mixed trading activity with a lack of strong buying interest.
Conclusion:
Based on the analysis of the technical indicators, the stock is likely to experience a short-term consolidation or pullback in the upcoming trading days. The overbought signals from momentum indicators and high volatility levels suggest a potential correction in the stock price. Traders should exercise caution and consider taking profits or implementing risk management strategies in anticipation of a downward movement.