Technical Analysis of ALGN 2024-05-10
Overview:
In analyzing the technical indicators for ALGN over the last 5 days, we will delve into the trend, momentum, volatility, and volume indicators to provide a comprehensive outlook on the possible stock price movement. By examining these key aspects, we aim to offer valuable insights and predictions for the upcoming days.
Trend Analysis:
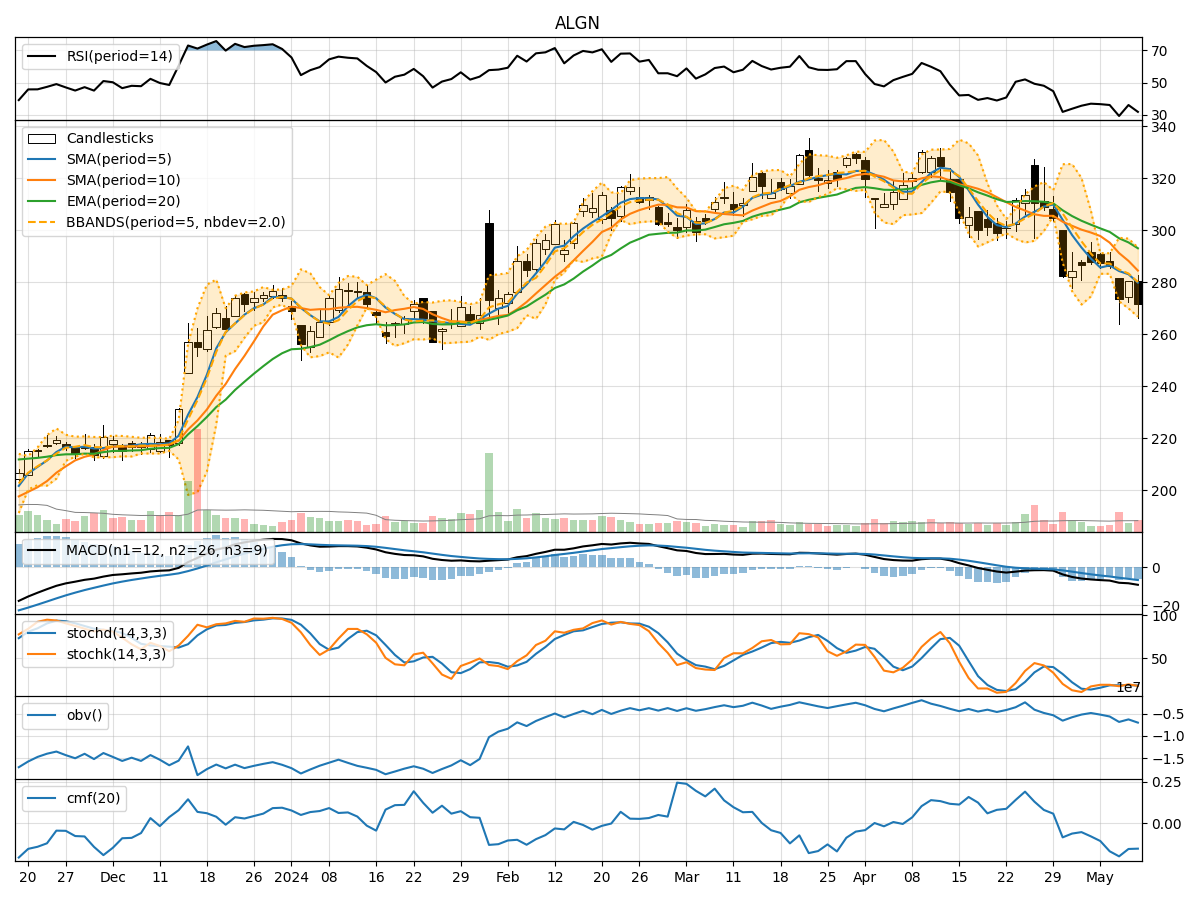
- Moving Averages (MA): The 5-day Moving Average (MA) has been consistently below both the Simple Moving Average (SMA) and Exponential Moving Average (EMA) over the past 5 days, indicating a downward trend.
- MACD: The Moving Average Convergence Divergence (MACD) has been negative, with the MACD line consistently below the signal line, suggesting bearish momentum.
Momentum Analysis:
- RSI: The Relative Strength Index (RSI) has been fluctuating in the oversold region, indicating a potential reversal or consolidation phase.
- Stochastic Oscillator: Both %K and %D have been in the oversold territory, signaling a potential buying opportunity.
Volatility Analysis:
- Bollinger Bands (BB): The stock price has been trading below the lower Bollinger Band, indicating oversold conditions and a possible reversal.
Volume Analysis:
- On-Balance Volume (OBV): The OBV has been declining, suggesting selling pressure in the stock.
- Chaikin Money Flow (CMF): The CMF has been negative, indicating a lack of buying interest in the stock.
Key Observations:
- The stock is currently in a downtrend based on moving averages and MACD.
- Momentum indicators suggest a possible reversal or consolidation phase.
- Volatility indicators point towards oversold conditions.
- Volume indicators indicate selling pressure and a lack of buying interest.
Conclusion:
Based on the analysis of the technical indicators, the next few days' possible stock price movement for ALGN is likely to see a short-term rebound or consolidation. The oversold conditions indicated by the Bollinger Bands and Stochastic Oscillator, coupled with the potential reversal signals from the RSI, suggest a temporary pause in the downtrend or a minor price correction. However, the overall trend remains bearish based on moving averages and MACD, so any upside movement is expected to be limited. Traders should exercise caution and consider waiting for further confirmation before entering any new positions.