Technical Analysis of AGBA 2024-05-10
Overview:
In analyzing the technical indicators for AGBA over the last 5 days, we will delve into the trend, momentum, volatility, and volume indicators to provide a comprehensive assessment of the stock's potential price movement. By examining these key indicators, we aim to offer valuable insights and predictions for the next few days.
Trend Analysis:
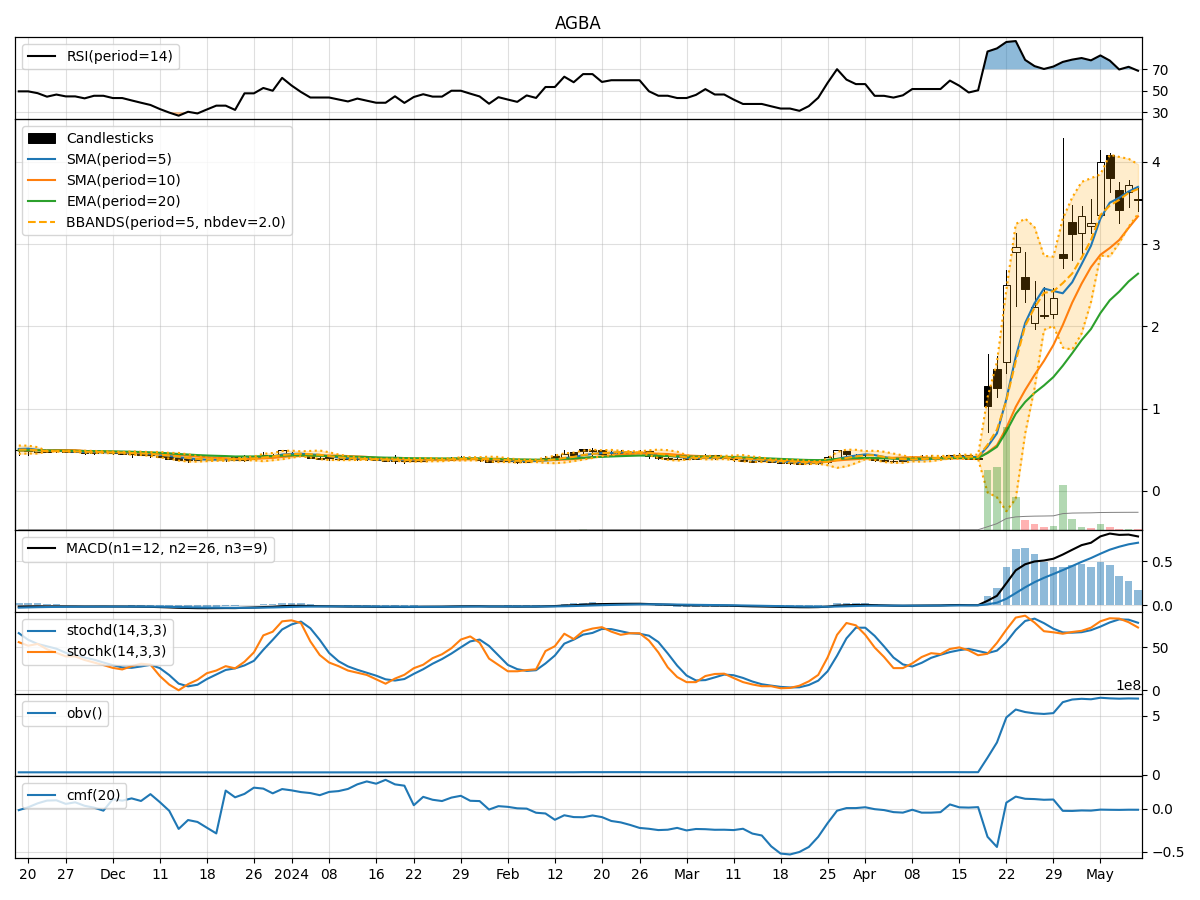
- Moving Averages (MA): The 5-day Moving Average (MA) has been consistently above the closing prices, indicating an upward trend. This suggests that the stock price has been trending higher over the past few days.
- MACD: The MACD line has been positive and above the signal line, reflecting bullish momentum in the stock price.
- EMA: The Exponential Moving Average (EMA) has been steadily increasing, further supporting the bullish trend in the stock.
Momentum Analysis:
- RSI: The Relative Strength Index (RSI) has been in the overbought territory, indicating that the stock may be overvalued in the short term.
- Stochastic Oscillator: Both %K and %D have been relatively high, suggesting that the stock is overbought and may experience a potential reversal.
- Williams %R: The Williams %R indicator has been in the oversold region, signaling a possible reversal in the stock price.
Volatility Analysis:
- Bollinger Bands (BB): The Bollinger Bands have been narrowing, indicating decreasing volatility in the stock price. This could suggest a period of consolidation or a potential breakout in the near future.
Volume Analysis:
- On-Balance Volume (OBV): The OBV indicator has been relatively stable, showing no significant divergence between price and volume. This suggests that the buying and selling pressure are balanced.
- Chaikin Money Flow (CMF): The CMF has been negative, indicating selling pressure in the stock.
Conclusion:
Based on the analysis of the technical indicators, the stock of AGBA is currently exhibiting a bullish trend supported by the moving averages and MACD. However, the momentum indicators such as RSI and Stochastic Oscillator suggest that the stock may be overbought in the short term. The narrowing Bollinger Bands indicate decreasing volatility, potentially leading to a period of consolidation before a possible breakout.
Considering the mixed signals from the momentum and volatility indicators, it is recommended to exercise caution in the short term. Traders may consider taking profits or implementing risk management strategies to navigate potential price fluctuations. Long-term investors should monitor the stock closely for any signs of a trend reversal or a new breakout.
In conclusion, while the overall trend remains bullish, the stock may experience a period of consolidation or a minor pullback before potentially resuming its upward trajectory. It is essential to stay vigilant and adapt to changing market conditions to make informed trading decisions.