Technical Analysis of AFRI 2024-05-10
Overview:
In analyzing the technical indicators for AFRI stock over the last 5 days, we will delve into the trend, momentum, volatility, and volume indicators to provide a comprehensive outlook on the possible stock price movement in the coming days. By examining these key indicators, we aim to offer valuable insights and predictions to guide your investment decisions.
Trend Analysis:
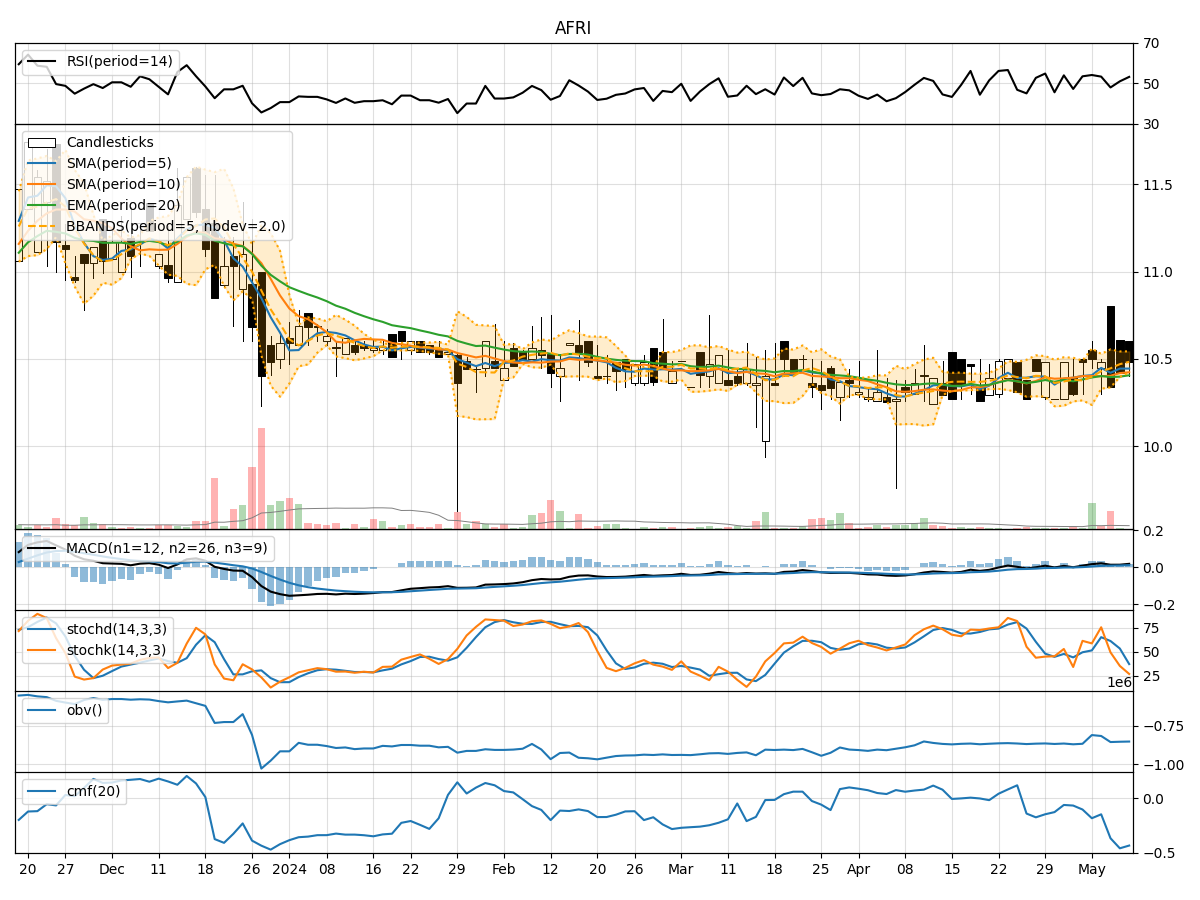
- Moving Averages (MA): The 5-day Moving Average (MA) has been relatively stable around the closing prices, indicating a consistent trend.
- MACD: The Moving Average Convergence Divergence (MACD) shows positive values, suggesting a bullish momentum in the short term.
- EMA: The Exponential Moving Average (EMA) has been slightly increasing, indicating a positive trend.
Momentum Analysis:
- RSI: The Relative Strength Index (RSI) has been fluctuating around the mid-level, indicating a neutral momentum.
- Stochastic Oscillator: Both %K and %D values have been decreasing, signaling a potential bearish momentum.
- Williams %R: The Williams %R is in the oversold territory, suggesting a possible reversal in momentum.
Volatility Analysis:
- Bollinger Bands: The Bollinger Bands width has been narrowing, indicating decreasing volatility.
- Bollinger %B: The %B value is relatively low, suggesting a potential consolidation phase.
- Average True Range (ATR): The ATR has been decreasing, indicating lower volatility levels.
Volume Analysis:
- On-Balance Volume (OBV): The OBV has been fluctuating, indicating mixed buying and selling pressure.
- Chaikin Money Flow (CMF): The CMF has been negative, suggesting a bearish sentiment in the market.
Key Observations and Opinions:
- Trend: The trend indicators show a slightly positive bias with stable moving averages and a bullish MACD.
- Momentum: The momentum indicators are mixed, with RSI neutral, Stochastic showing bearish signals, and Williams %R in oversold territory.
- Volatility: Volatility has been decreasing, indicating a potential consolidation phase.
- Volume: The volume indicators suggest mixed sentiment with fluctuating OBV and negative CMF.
Conclusion:
Based on the analysis of the technical indicators, the stock price of AFRI is likely to experience sideways movement in the coming days. The trend is slightly bullish, supported by the MACD, while momentum indicators show mixed signals. Volatility is decreasing, indicating a potential consolidation phase, and volume indicators suggest a lack of clear direction in buying or selling pressure. Overall, the stock is expected to trade within a narrow range in the near term.