Technical Analysis of AFMD 2024-05-10
Overview:
In analyzing the technical indicators for AFMD over the last 5 days, we will delve into the trend, momentum, volatility, and volume indicators to provide a comprehensive outlook on the possible stock price movement in the coming days. By examining these key aspects, we aim to offer valuable insights and predictions for potential investors.
Trend Analysis:
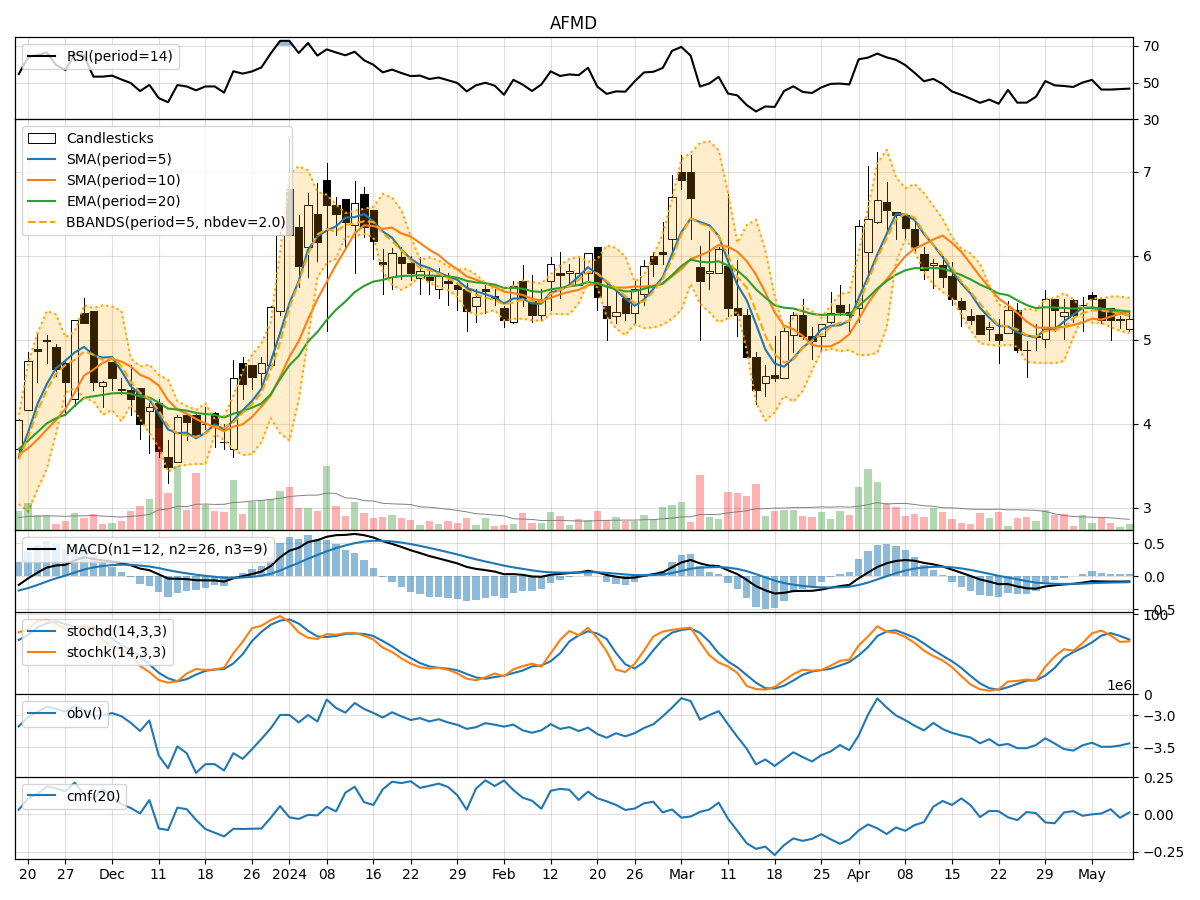
- Moving Averages (MA): The 5-day Moving Average (MA) has been fluctuating around the closing prices, indicating a lack of clear trend direction.
- MACD: The Moving Average Convergence Divergence (MACD) has been consistently negative, suggesting a bearish momentum in the short term.
- EMA: The Exponential Moving Average (EMA) has been declining, further supporting the bearish sentiment in the stock.
Momentum Analysis:
- RSI: The Relative Strength Index (RSI) has been hovering around the neutral zone, indicating a lack of strong momentum either bullish or bearish.
- Stochastic Oscillator: Both %K and %D have been fluctuating, not providing a clear signal on the stock's momentum.
- Williams %R: The Williams %R is also near the oversold territory, suggesting a potential reversal in the stock's price.
Volatility Analysis:
- Bollinger Bands: The Bollinger Bands have been narrowing, indicating decreasing volatility in the stock.
- Bollinger %B: The %B indicator is below 1, suggesting the stock is trading below the lower band, potentially indicating an oversold condition.
Volume Analysis:
- On-Balance Volume (OBV): The OBV has been declining, indicating selling pressure in the stock.
- Chaikin Money Flow (CMF): The CMF has been mixed, showing indecision among investors regarding the stock.
Key Observations:
- The trend indicators suggest a bearish sentiment in the stock, with the MACD and EMA pointing towards a downward trend.
- Momentum indicators are inconclusive, with RSI and Stochastic Oscillator not providing a clear direction.
- Volatility has been decreasing, indicating a possible period of consolidation or a potential breakout.
- Volume indicators show selling pressure, as indicated by the declining OBV.
Conclusion:
Based on the analysis of the technical indicators, the stock of AFMD is currently bearish in the short term. The trend indicators, specifically the MACD and EMA, suggest a downward movement in the stock price. While momentum indicators are inconclusive, the overall sentiment leans towards a bearish outlook. The decreasing volatility and selling pressure indicated by volume indicators further support this view.
Recommendation:
Considering the bearish sentiment and the lack of strong positive signals from the technical indicators, it is advisable to exercise caution when considering investments in AFMD in the coming days. Traders may look for potential short-selling opportunities or wait for a clearer trend reversal confirmation before considering long positions. Monitoring key support levels and waiting for a bullish confirmation from momentum indicators could provide a more favorable entry point for investors.