Technical Analysis of AFAR 2024-05-10
Overview:
In analyzing the technical indicators for AFAR stock over the last 5 days, we will delve into the trend, momentum, volatility, and volume indicators to provide a comprehensive outlook on the possible stock price movement in the coming days. By examining these key indicators, we aim to offer valuable insights and recommendations for potential investors.
Trend Analysis:
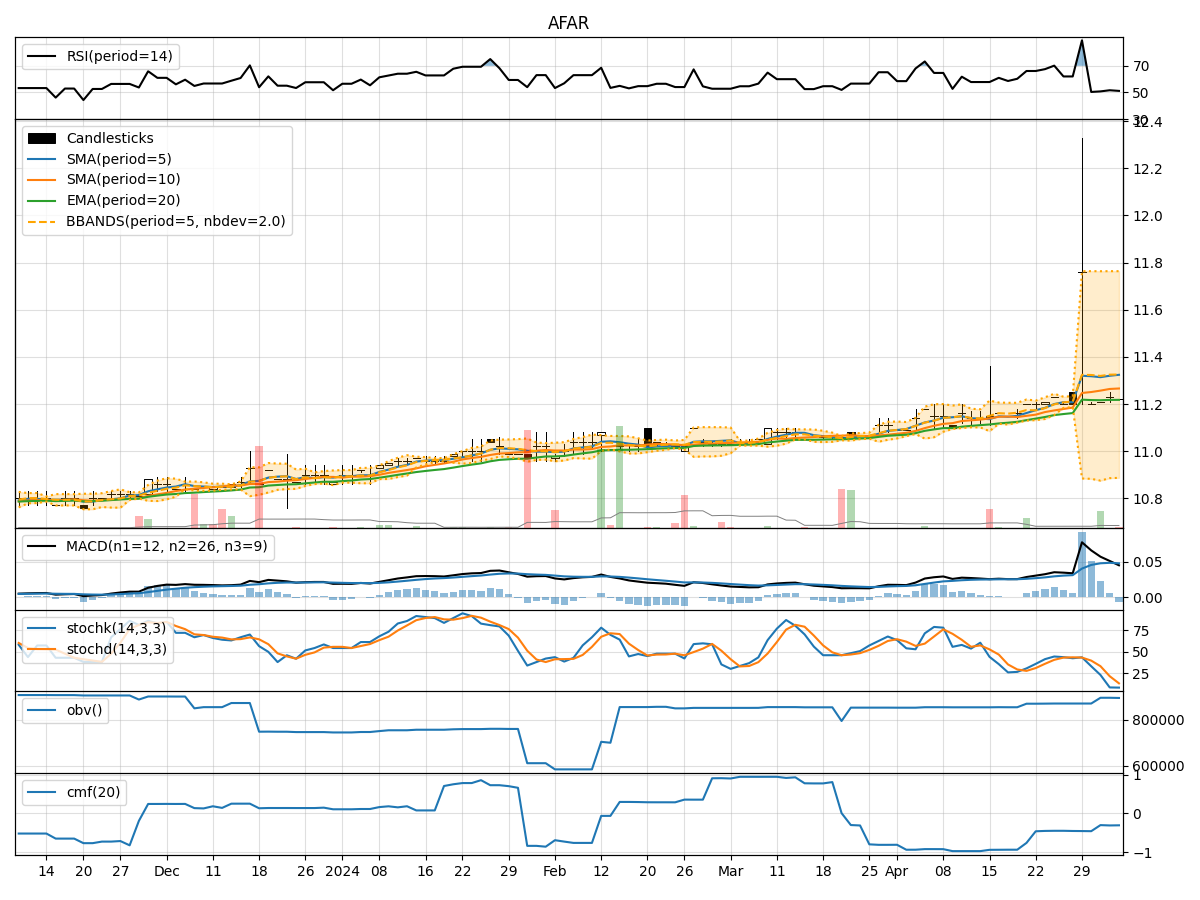
- Moving Averages (MA): The 5-day Moving Average (MA) has been relatively stable around the current stock price, indicating a neutral trend.
- MACD: The Moving Average Convergence Divergence (MACD) shows a slight positive momentum, with the MACD line above the signal line.
- RSI: The Relative Strength Index (RSI) is hovering around the neutral zone, suggesting a balanced momentum.
Key Observation: The trend indicators suggest a neutral to slightly positive sentiment in the stock price movement.
Momentum Analysis:
- Stochastic Oscillator: The Stochastic Oscillator indicates oversold conditions, potentially signaling a reversal in the stock price.
- Williams %R: The Williams %R also shows extreme oversold levels, hinting at a possible upward movement.
Key Observation: Momentum indicators point towards a potential reversal or upward movement in the stock price.
Volatility Analysis:
- Bollinger Bands: The Bollinger Bands are narrowing, indicating decreasing volatility and a possible period of consolidation.
- Volatility Bands: The Volatility Bands show a decreasing range, suggesting a stabilization in price fluctuations.
Key Observation: Volatility indicators signal a period of consolidation and reduced price volatility.
Volume Analysis:
- On-Balance Volume (OBV): The OBV has remained relatively flat, indicating a balance between buying and selling pressure.
- Chaikin Money Flow (CMF): The CMF is negative, reflecting a slight outflow of money from the stock.
Key Observation: Volume indicators suggest a lack of significant buying or selling pressure in the stock.
Conclusion:
Based on the analysis of the technical indicators, the next few days' possible stock price movement for AFAR is likely to be sideways with a potential upward bias. The trend indicators show a neutral to slightly positive sentiment, while momentum indicators hint at a possible reversal to the upside. Volatility indicators point towards a period of consolidation, and volume indicators indicate a balanced market sentiment.
Overall, the technical analysis suggests a potential for the stock price to consolidate in the near term with a slight inclination towards an upward movement. Investors should closely monitor key support and resistance levels for confirmation of the anticipated price action.