Technical Analysis of AERT 2024-05-10
Overview:
In analyzing the technical indicators for AERT over the last 5 days, we will delve into the trend, momentum, volatility, and volume indicators to provide a comprehensive outlook on the possible stock price movement in the coming days. By examining these key indicators, we aim to offer valuable insights and predictions for potential investors.
Trend Analysis:
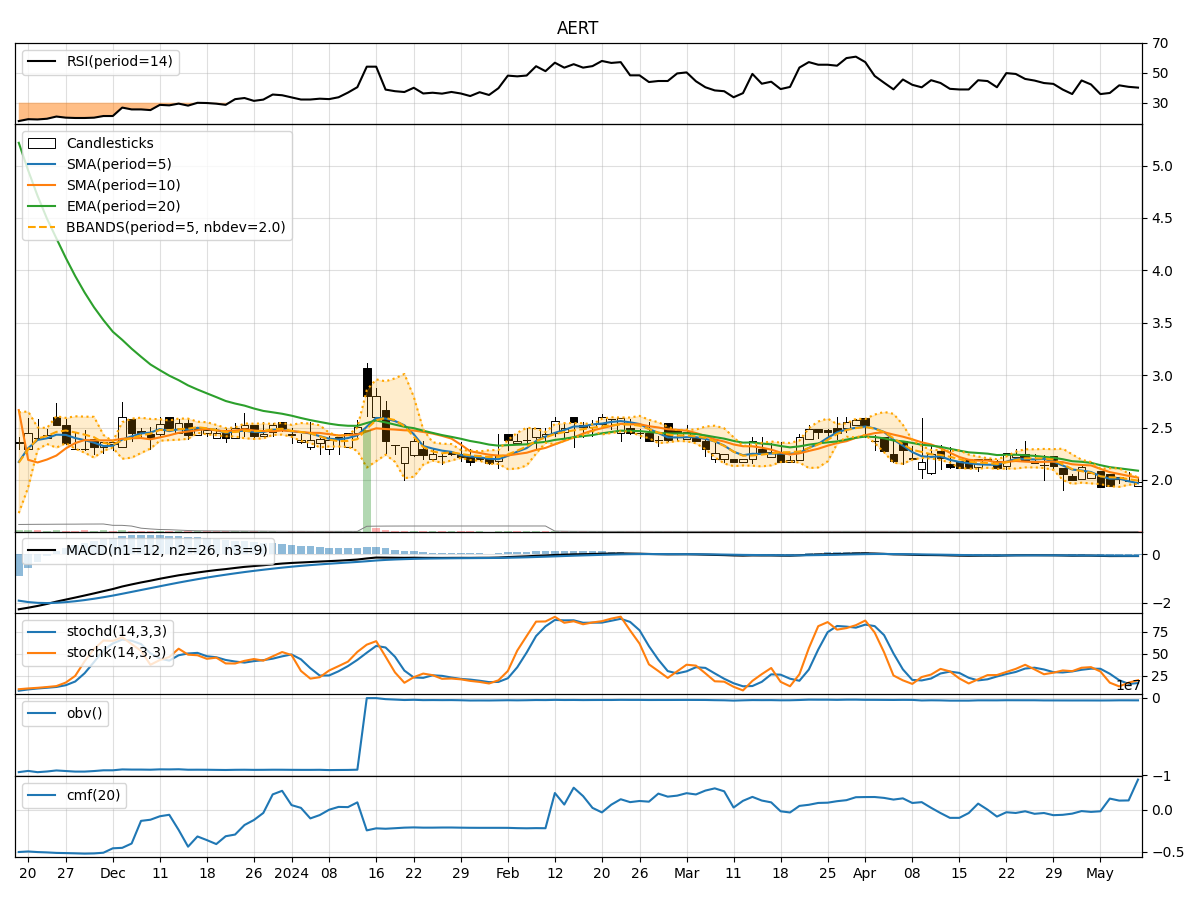
- Moving Averages (MA): The 5-day moving average (MA) has been consistently below the simple moving average (SMA) and exponential moving average (EMA) over the past 5 days, indicating a downward trend.
- MACD: The MACD line has been negative, with the MACD histogram also showing a downward trend, suggesting bearish momentum in the stock price.
Momentum Analysis:
- RSI: The Relative Strength Index (RSI) has been hovering around 40, indicating a neutral momentum in the stock.
- Stochastic Oscillator: Both %K and %D of the Stochastic Oscillator have been relatively low, signaling a potential oversold condition in the stock.
Volatility Analysis:
- Bollinger Bands (BB): The stock price has been trading within the lower Bollinger Band, indicating lower volatility and a potential consolidation phase.
- Bollinger Band Width (BBW): The Bollinger Band Width has been narrowing, suggesting a decrease in volatility and a possible period of price consolidation.
Volume Analysis:
- On-Balance Volume (OBV): The OBV has been negative, indicating a net selling pressure in the stock.
- Chaikin Money Flow (CMF): The CMF has been positive, suggesting that money flow into the stock has been relatively strong over the past 20 days.
Key Observations:
- The stock is currently in a downtrend based on moving averages and MACD indicators.
- Momentum is neutral to slightly bearish, as indicated by RSI and Stochastic Oscillator.
- Volatility is decreasing, with the stock price consolidating within the lower Bollinger Band.
- Volume indicators show a net selling pressure, although money flow into the stock remains relatively strong.
Conclusion:
Based on the analysis of the technical indicators, the stock is likely to continue its downward trend in the short term. The momentum is not strong enough to support a significant upward movement, and the volatility is low, indicating a period of consolidation. Investors should exercise caution and consider waiting for more bullish signals before considering a long position in AERT.