Technical Analysis of ADSK 2024-05-10
Overview:
In analyzing the technical indicators for Autodesk Inc. (ADSK) over the last 5 days, we will delve into the trend, momentum, volatility, and volume indicators to provide a comprehensive outlook on the possible stock price movement in the coming days. By examining these key indicators, we aim to offer valuable insights and predictions for potential investors and traders.
Trend Indicators:
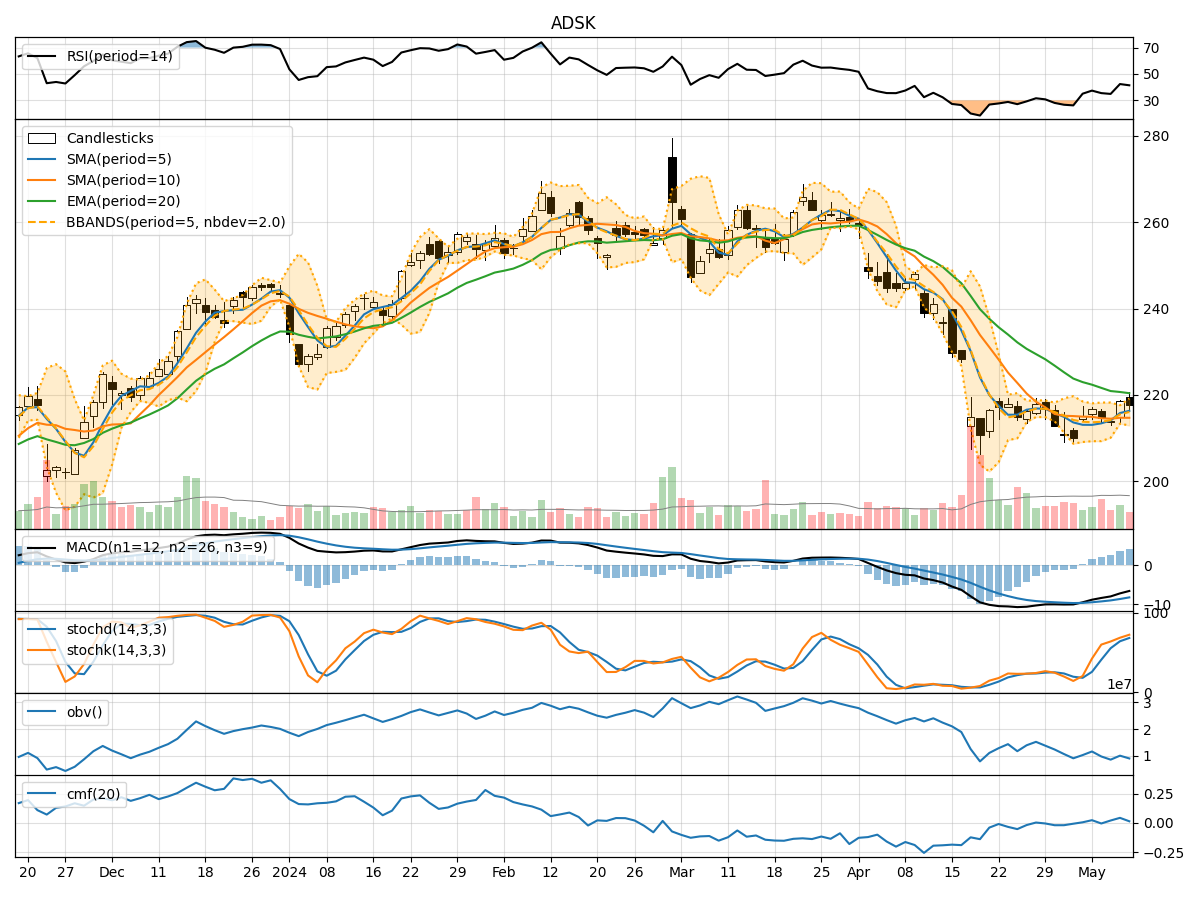
- Moving Averages (MA): The 5-day MA has been fluctuating around the current price levels, indicating a lack of clear trend direction.
- MACD: The MACD line has been showing a slight positive divergence, suggesting a potential bullish momentum.
- EMA: The EMA has been gradually declining, indicating a bearish sentiment in the short term.
Momentum Indicators:
- RSI: The RSI has been hovering around the oversold territory, indicating a potential reversal or consolidation phase.
- Stochastic Oscillator: Both %K and %D have been in the overbought zone, signaling a possible pullback or correction.
- Williams %R: The Williams %R is also in the oversold region, suggesting a potential buying opportunity.
Volatility Indicators:
- Bollinger Bands (BB): The bands have been narrowing, indicating decreasing volatility and a potential breakout in the near future.
- BB %B: The %B indicator is currently below 1, suggesting a possible oversold condition and a potential reversal.
Volume Indicators:
- On-Balance Volume (OBV): The OBV has been fluctuating, indicating indecision among market participants.
- Chaikin Money Flow (CMF): The CMF has been slightly positive, suggesting some buying pressure in the market.
Key Observations and Opinions:
- Trend: The trend indicators show mixed signals, with the MACD hinting at a potential bullish momentum while the EMA indicates a bearish sentiment. Overall, the trend is uncertain.
- Momentum: The momentum indicators suggest a possible reversal or consolidation phase, with the RSI and Stochastic Oscillator signaling conflicting signals.
- Volatility: The narrowing Bollinger Bands indicate a potential breakout, while the %B suggests a possible oversold condition.
- Volume: The volume indicators show indecision among market participants, with the OBV fluctuating and the CMF slightly positive.
Conclusion:
Based on the analysis of the technical indicators, the next few days for ADSK could see sideways movement with a slight bullish bias. Traders should exercise caution and wait for a clearer trend to emerge before making significant trading decisions. Keep a close eye on key levels and wait for confirmation from multiple indicators before taking any positions.