Technical Analysis of ADI 2024-05-10
Overview:
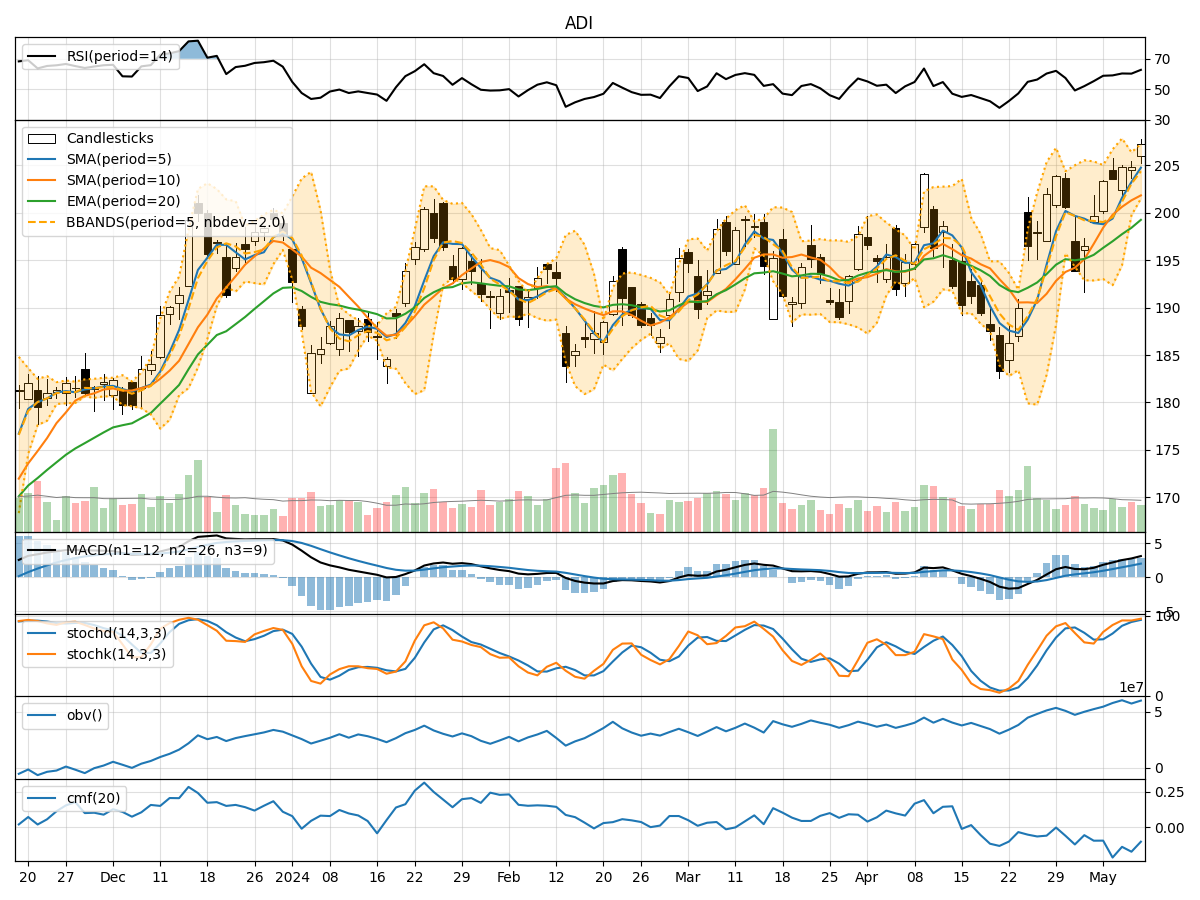
In the last 5 trading days, Analog Devices Inc. (ADI) has shown a consistent uptrend in its stock price, accompanied by increasing trading volumes. The moving averages have been trending upwards, indicating a positive momentum in the stock. The MACD and RSI indicators also suggest bullish sentiment. However, the Bollinger Bands and Stochastic indicators show signs of potential overbought conditions. Let's delve deeper into each category of technical indicators to provide a comprehensive analysis and make a prediction for the next few days.
Trend Indicators:
- Moving Averages (MA): The 5-day MA has been consistently above the longer-term SMAs, indicating a strong uptrend.
- MACD: The MACD line has been above the signal line, showing bullish momentum.
- Conclusion: The trend indicators suggest a strong upward momentum in the stock price.
Momentum Indicators:
- RSI: The RSI has been in the overbought territory but has room for further upside.
- Stochastic Oscillator: Both %K and %D are in the overbought zone, indicating a potential reversal.
- Conclusion: Momentum indicators suggest a cautious outlook due to potential overbought conditions.
Volatility Indicators:
- Bollinger Bands (BB): The stock price has been consistently trading above the upper Bollinger Band, indicating overbought conditions.
- Conclusion: Volatility indicators suggest a potential pullback or consolidation in the stock price.
Volume Indicators:
- On-Balance Volume (OBV): The OBV has been trending upwards, confirming the buying pressure.
- Chaikin Money Flow (CMF): The CMF has been negative, indicating some distribution.
- Conclusion: Volume indicators suggest mixed signals, with OBV supporting the uptrend but CMF showing distribution.
Overall Conclusion:
Based on the analysis of technical indicators, the next few days' possible stock price movement for ADI is likely to experience a short-term pullback or consolidation. While the trend indicators signal a strong upward momentum, the overbought conditions highlighted by momentum and volatility indicators suggest a potential correction in the stock price. Traders should exercise caution and consider taking profits or implementing risk management strategies in anticipation of a temporary reversal in the stock price.
Key Recommendations:
- Monitor Price Action: Keep a close eye on the stock price movement for any signs of reversal or consolidation.
- Use Stop-Loss Orders: Implement stop-loss orders to protect profits in case of a sudden downturn.
- Consider Profit Booking: If holding a long position, consider booking partial profits to lock in gains.
- Wait for Confirmation: Wait for confirmation from multiple indicators before making significant trading decisions.
In conclusion, while the overall trend for ADI remains bullish, the technical indicators suggest a potential short-term correction or consolidation. Traders should remain vigilant and adapt their strategies accordingly to navigate the upcoming market dynamics.