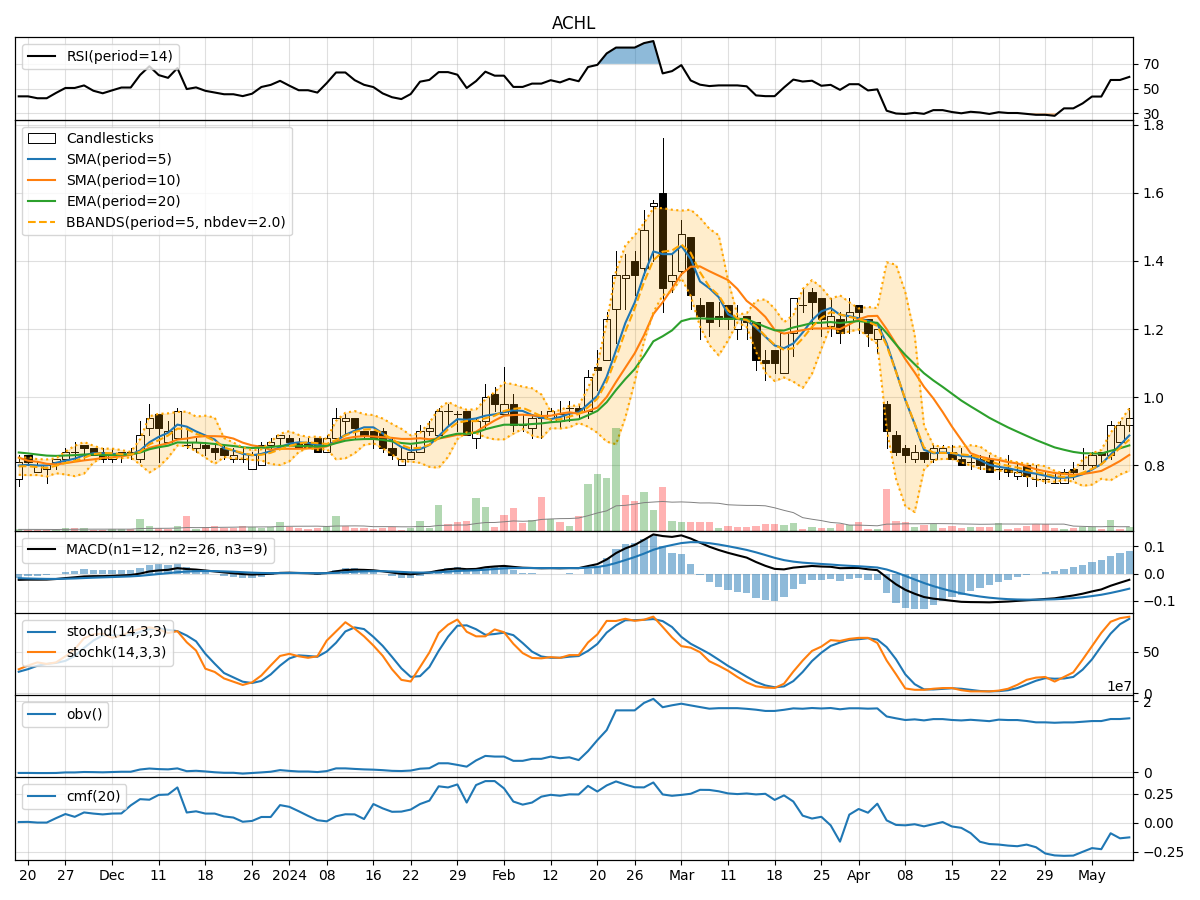
Technical Analysis of ACHL 2024-05-10
Overview:
In analyzing the technical indicators for ACHL over the last 5 days, we will delve into the trend, momentum, volatility, and volume indicators to provide a comprehensive outlook on the possible stock price movement in the coming days. By examining these key aspects, we aim to offer valuable insights and predictions to guide investment decisions.
Trend Analysis:
- Moving Averages (MA): The 5-day Moving Average (MA) has been consistently rising, indicating a bullish trend in the short term.
- MACD: The Moving Average Convergence Divergence (MACD) shows a positive trend with the MACD line consistently above the signal line, suggesting upward momentum.
- EMA: The Exponential Moving Average (EMA) has been trending upwards, supporting the bullish sentiment in the stock.
Momentum Analysis:
- RSI: The Relative Strength Index (RSI) has been increasing, indicating strengthening momentum in the stock.
- Stochastic Oscillator: Both %K and %D lines of the Stochastic Oscillator are in the overbought zone, suggesting a potential reversal or consolidation.
- Williams %R: The Williams %R is in the oversold territory, indicating a possible buying opportunity.
Volatility Analysis:
- Bollinger Bands: The Bollinger Bands are widening, indicating increased volatility in the stock price.
- Bollinger %B: The %B indicator is below 1, suggesting that the stock price is trading below the lower Bollinger Band, potentially indicating an oversold condition.
Volume Analysis:
- On-Balance Volume (OBV): The OBV indicator has been relatively flat, indicating a balance between buying and selling pressure.
- Chaikin Money Flow (CMF): The CMF is negative, suggesting that money is flowing out of the stock.
Key Observations and Opinions:
- Trend: The stock is in a strong bullish trend based on moving averages and MACD.
- Momentum: The momentum indicators suggest a potential overbought condition, signaling a need for caution.
- Volatility: Increasing volatility could lead to larger price swings in the coming days.
- Volume: The volume indicators show a lack of strong buying or selling pressure.
Conclusion:
Based on the analysis of the technical indicators, the next few days' possible stock price movement for ACHL is likely to experience a short-term pullback or consolidation. The stock has shown signs of being overbought, coupled with negative money flow and potential oversold conditions. Investors should exercise caution and consider waiting for a better entry point before initiating new positions.