Technical Analysis of ACGL 2024-05-10
Overview:
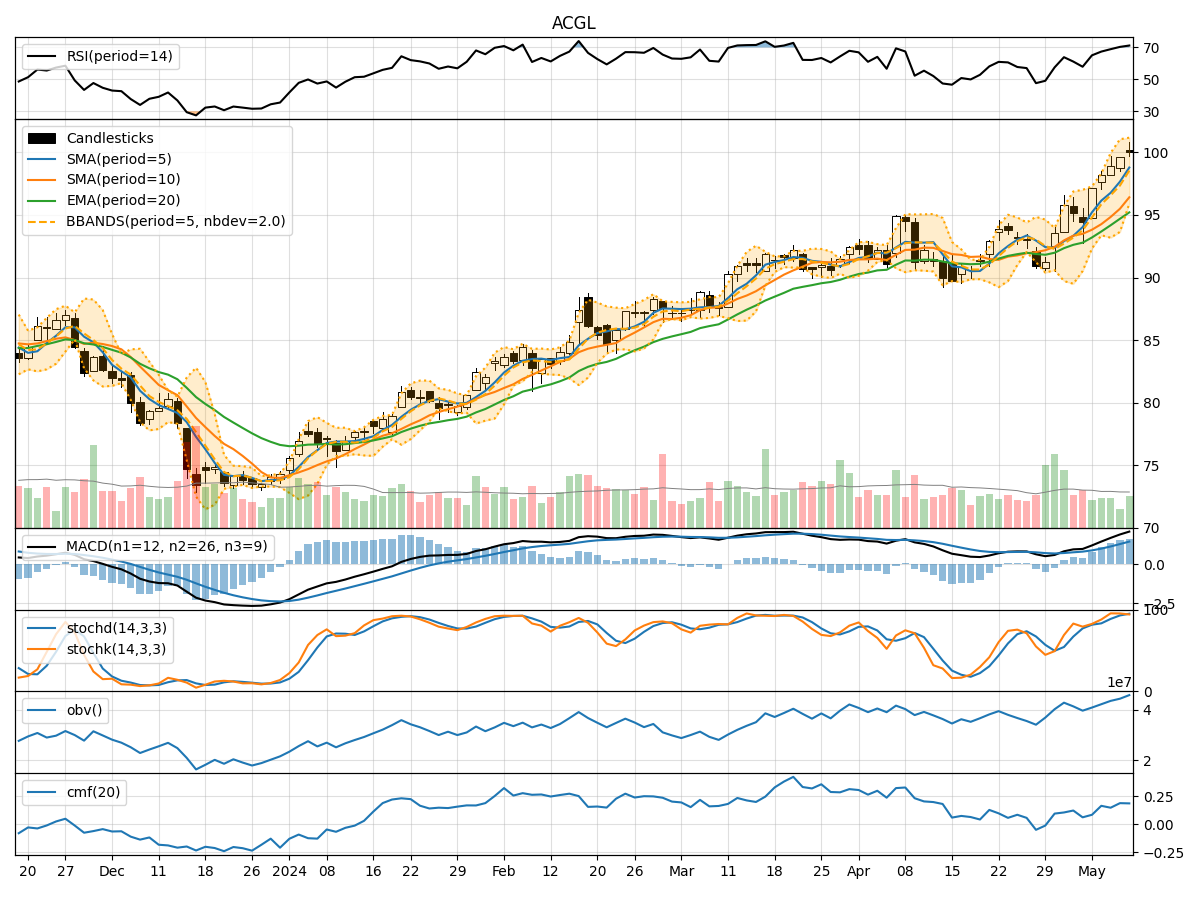
In analyzing the technical indicators for ACGL over the last 5 days, we will delve into the trend, momentum, volatility, and volume indicators to provide a comprehensive outlook on the possible stock price movement in the coming days.
Trend Indicators:
- Moving Averages (MA): The 5-day moving average has been consistently rising, indicating an upward trend in the stock price.
- MACD: The MACD line has been increasing, and the MACD histogram is also showing positive values, suggesting bullish momentum.
- EMA: The exponential moving average has been trending upwards, supporting the bullish sentiment in the short to medium term.
Momentum Indicators:
- RSI: The Relative Strength Index has been increasing and is currently in the overbought territory, signaling strong buying momentum.
- Stochastic Oscillator: Both %K and %D lines are in the overbought zone, indicating a potential reversal or consolidation in the near future.
- Williams %R: The Williams %R is in the oversold region, suggesting a possible pullback or correction.
Volatility Indicators:
- Bollinger Bands: The stock price has been trading above the upper Bollinger Band, indicating overbought conditions and a potential reversal or consolidation.
- Bollinger Band Width: The band width has been narrowing, suggesting a decrease in volatility and a possible period of consolidation.
Volume Indicators:
- On-Balance Volume (OBV): The OBV has been steadily increasing, reflecting strong buying pressure and accumulation of the stock.
- Chaikin Money Flow (CMF): The CMF is positive, indicating that money is flowing into the stock, supporting the bullish bias.
Key Observations and Opinions:
- Trend: The trend indicators suggest a strong bullish bias in the stock price.
- Momentum: While momentum indicators show overbought conditions, the RSI and Stochastic Oscillator signal potential for a pullback or consolidation.
- Volatility: The narrowing Bollinger Band width indicates a potential decrease in volatility and a period of consolidation.
- Volume: The increasing OBV and positive CMF support the bullish outlook for the stock.
Conclusion:
Based on the analysis of the technical indicators, the stock of ACGL is currently in an overbought state with strong bullish momentum. However, the overbought conditions in the momentum indicators and the stock trading above the upper Bollinger Band suggest a potential pullback or consolidation in the near future. Traders should exercise caution and consider taking profits or implementing risk management strategies in anticipation of a short-term correction.