Technical Analysis of ACB 2024-05-03
Overview:
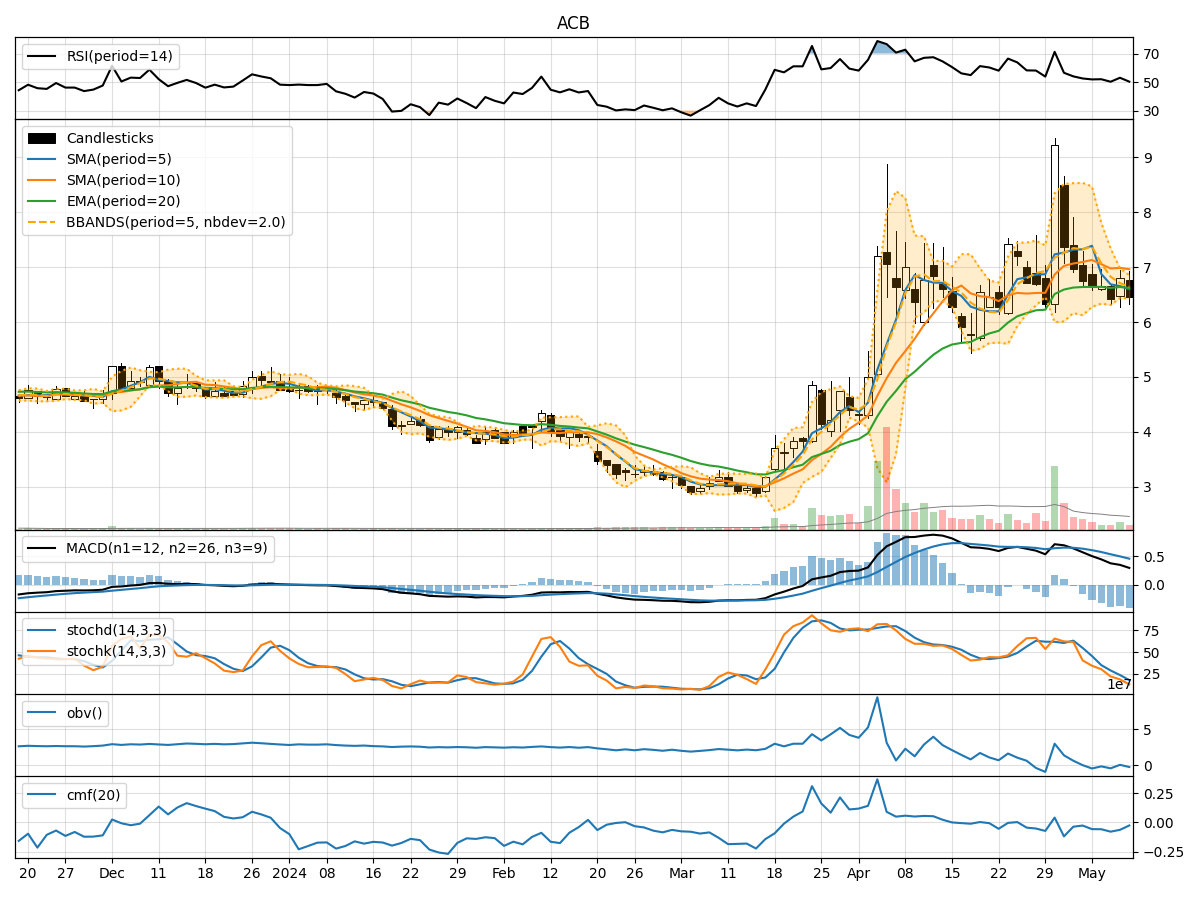
In the last 5 trading days, ACB stock has shown mixed signals across various technical indicators. The stock price has fluctuated, indicating uncertainty in the market sentiment. By analyzing trend, momentum, volatility, and volume indicators, we can gain insights into the possible future price movement of ACB stock.
Trend Indicators Analysis:
- Moving Averages (MA): The 5-day MA has been fluctuating around the stock price, indicating short-term volatility.
- Exponential Moving Average (EMA): The EMA has been relatively stable, suggesting a smoother trend.
- Moving Average Convergence Divergence (MACD): The MACD line has been close to the signal line, indicating potential trend changes.
Key Observation: The trend indicators show mixed signals, with the MACD suggesting a possible shift in momentum.
Momentum Indicators Analysis:
- Relative Strength Index (RSI): RSI values have been fluctuating around the midline, indicating indecision in the market.
- Stochastic Oscillator: Both %K and %D have shown fluctuations, suggesting potential reversals.
- Williams %R (Willams %R): The indicator has been in oversold territory, indicating a possible buying opportunity.
Key Observation: Momentum indicators suggest a lack of clear direction in the market sentiment.
Volatility Indicators Analysis:
- Bollinger Bands (BB): The bands have widened, indicating increased volatility in the stock price.
Key Observation: Volatility has increased, which could lead to larger price swings in the near future.
Volume Indicators Analysis:
- On-Balance Volume (OBV): The OBV has shown mixed signals, indicating uncertainty in the accumulation/distribution of the stock.
- Chaikin Money Flow (CMF): The CMF has been negative, suggesting selling pressure in the market.
Key Observation: Volume indicators reflect mixed signals, with no clear accumulation or distribution pattern.
Conclusion:
Based on the analysis of trend, momentum, volatility, and volume indicators, the next few days' possible stock price movement for ACB is uncertain. The mixed signals across indicators suggest a lack of clear trend or momentum direction. The increased volatility could lead to larger price swings, while the volume indicators do not provide a clear picture of market sentiment. Traders and investors should exercise caution and closely monitor the market for any potential shifts in trend or momentum before making any trading decisions.