Technical Analysis of ABVX 2024-05-10
Overview:
In analyzing the technical indicators for ABVX over the last 5 days, we will delve into the trend, momentum, volatility, and volume indicators to provide a comprehensive outlook on the possible stock price movement in the coming days. By examining these key aspects, we aim to offer valuable insights and predictions to guide your investment decisions.
Trend Analysis:
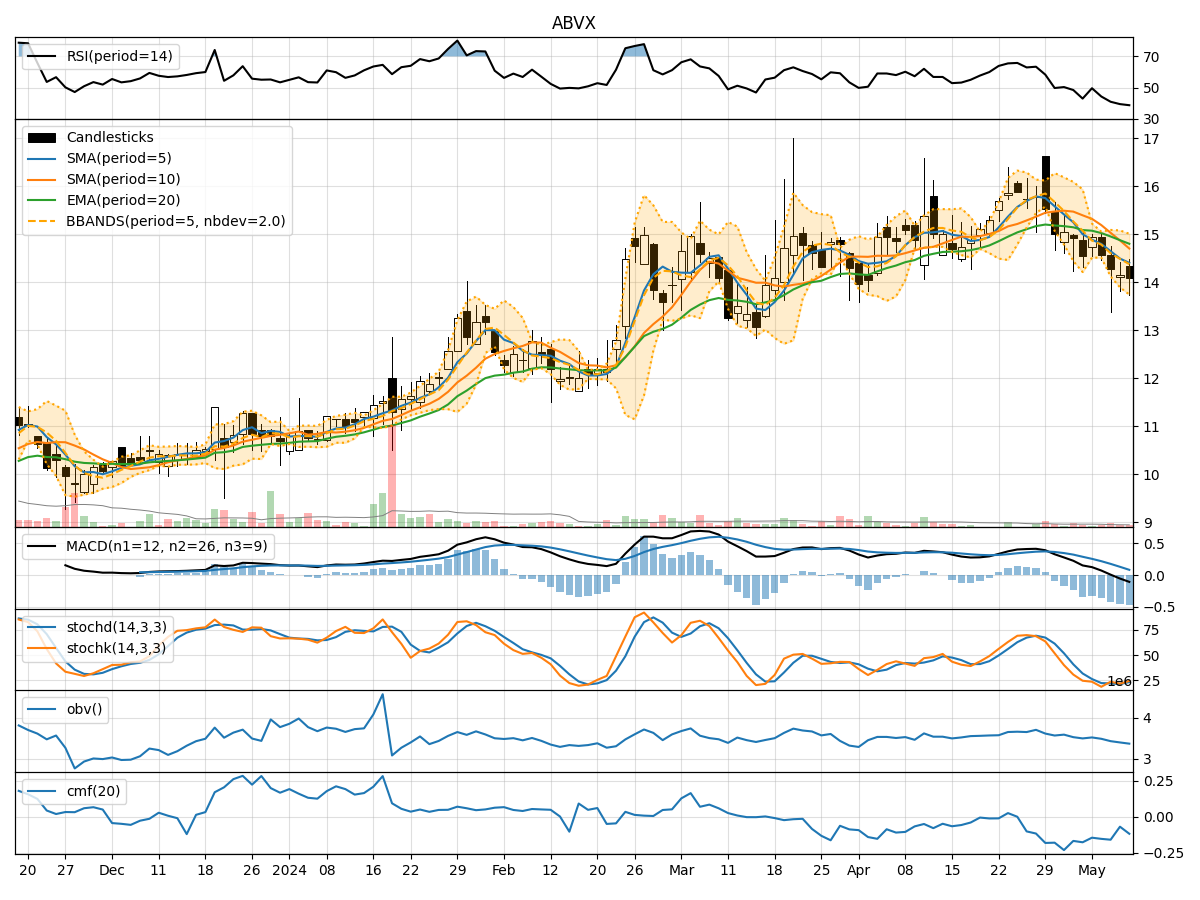
- Moving Averages (MA): The 5-day MA has been consistently below the SMA(10) and EMA(20), indicating a short-term bearish trend.
- MACD: The MACD line has been below the signal line, with a negative MACD histogram, suggesting a bearish momentum.
Key Observation: The trend indicators point towards a downward trend in the stock price.
Momentum Analysis:
- RSI: The RSI has been decreasing and is below 50, indicating weakening momentum.
- Stochastic Oscillator: Both %K and %D have been trending downwards, reflecting a bearish momentum.
- Williams %R: The indicator is in the oversold territory, suggesting a potential reversal.
Key Observation: Momentum indicators signal a bearish sentiment in the stock.
Volatility Analysis:
- Bollinger Bands: The stock price has been consistently below the lower Bollinger Band, indicating oversold conditions.
Key Observation: Volatility indicators suggest the stock is oversold and may see a potential reversal.
Volume Analysis:
- On-Balance Volume (OBV): The OBV has been declining, indicating selling pressure.
- Chaikin Money Flow (CMF): The CMF is negative, signaling outflows from the stock.
Key Observation: Volume indicators support the bearish sentiment in the stock.
Conclusion:
Based on the analysis of trend, momentum, volatility, and volume indicators, the overall outlook for ABVX in the next few days is bearish. The stock is likely to continue its downward trend, supported by weakening momentum, oversold conditions, and persistent selling pressure. Investors should exercise caution and consider waiting for signs of a potential reversal before considering any long positions.
Key Conclusion:
The technical analysis suggests a downward trajectory for ABVX in the coming days, with a high probability of further price declines. It is advisable to monitor the indicators closely for any signs of a trend reversal before considering any bullish positions.