Technical Analysis of ABTS 2024-05-10
Overview:
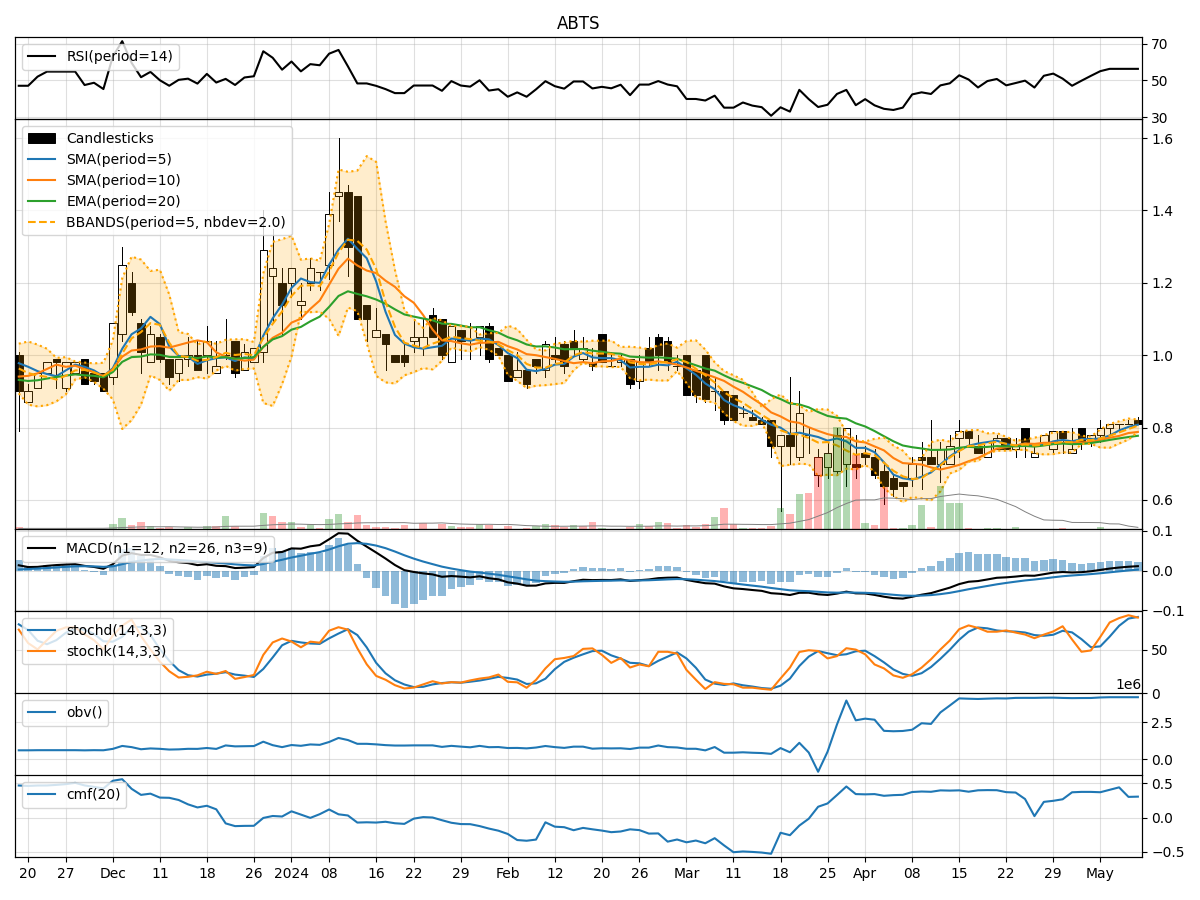
In analyzing the technical indicators for ABTS over the last 5 days, we will delve into the trend, momentum, volatility, and volume indicators to provide a comprehensive outlook on the possible stock price movement. By examining these key aspects, we aim to offer valuable insights and predictions for the upcoming days.
Trend Analysis:
- Moving Averages (MA): The 5-day Moving Average (MA) has been consistently above the Simple Moving Average (SMA) and Exponential Moving Average (EMA), indicating a bullish trend.
- MACD: The MACD line has been consistently above the signal line, with both lines showing an upward trend, suggesting bullish momentum.
- RSI: The Relative Strength Index (RSI) has been hovering around 56.58, indicating a neutral stance in terms of momentum.
Momentum Analysis:
- Stochastic Oscillator: The Stochastic Oscillator has been in the overbought territory, suggesting a potential reversal or consolidation in the near future.
- Williams %R: The Williams %R indicator has been consistently in the oversold region, indicating a potential buying opportunity.
Volatility Analysis:
- Bollinger Bands (BB): The Bollinger Bands have been narrowing, indicating decreasing volatility and a possible period of consolidation.
- Average True Range (ATR): The ATR has been decreasing, further supporting the notion of reduced volatility.
Volume Analysis:
- On-Balance Volume (OBV): The OBV has been relatively stable, suggesting a balance between buying and selling pressure.
- Chaikin Money Flow (CMF): The CMF has been fluctuating around 0.30, indicating a neutral stance in terms of money flow.
Key Observations:
- The trend indicators suggest a bullish sentiment, supported by the MACD and moving averages.
- Momentum indicators show conflicting signals, with the Stochastic Oscillator in the overbought region and the Williams %R in the oversold territory.
- Volatility indicators point towards a period of consolidation, as evidenced by the narrowing Bollinger Bands and decreasing ATR.
- Volume indicators indicate a balanced market sentiment, with no clear dominance of buying or selling pressure.
Conclusion:
Based on the analysis of the technical indicators, the next few days for ABTS are likely to see sideways movement with a slight bullish bias. Traders should exercise caution due to conflicting signals from momentum indicators and be prepared for potential consolidation based on volatility indicators. It is advisable to closely monitor key support and resistance levels for better decision-making in the current market environment.