Technical Analysis of AACG 2024-05-10
Overview:
In analyzing the technical indicators for AACG over the last 5 days, we will delve into the trend, momentum, volatility, and volume indicators to provide a comprehensive outlook on the possible stock price movement in the coming days.
Trend Analysis:
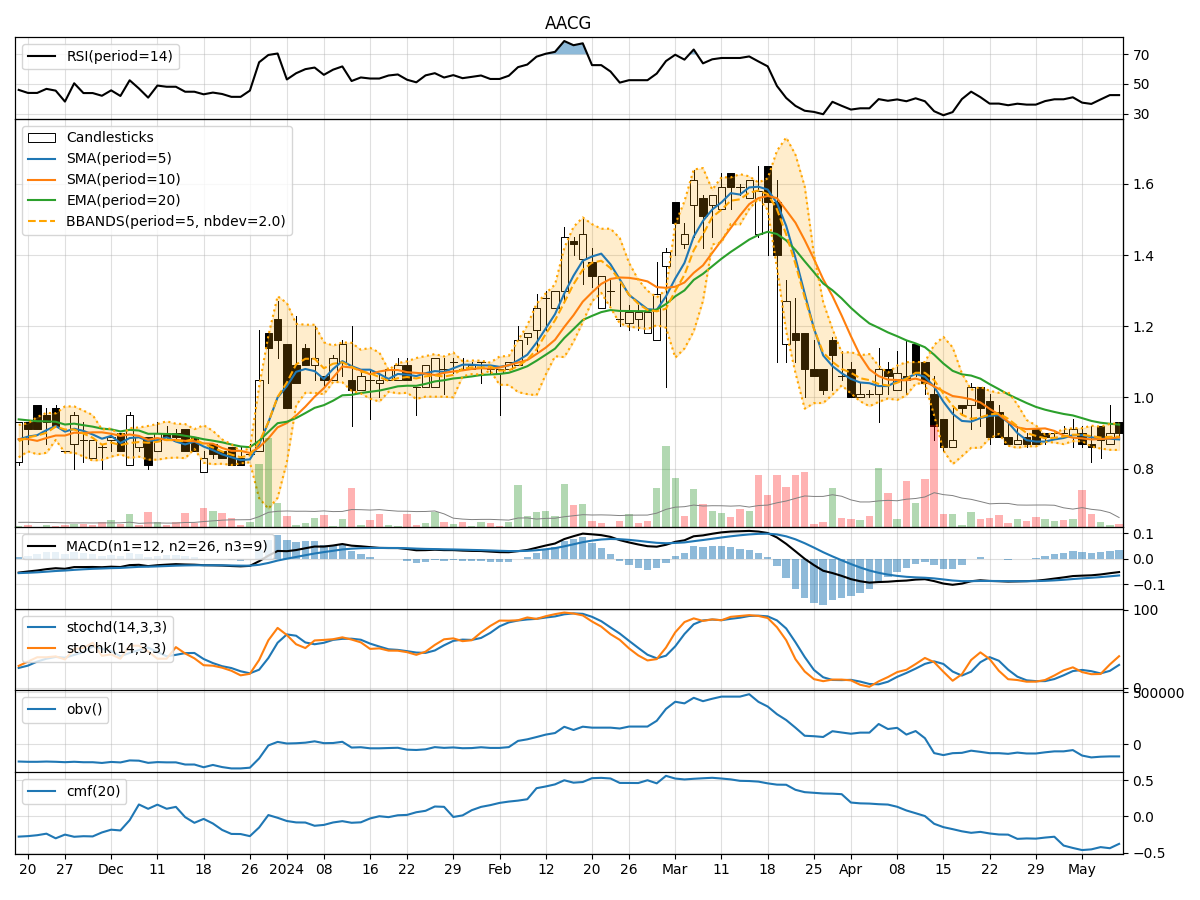
- Moving Averages (MA): The 5-day Moving Average (MA) has been declining slightly, indicating a short-term bearish trend.
- MACD: The MACD line has been consistently negative, suggesting a bearish momentum in the stock.
- EMA: The Exponential Moving Average (EMA) has also been trending downwards, aligning with the bearish sentiment in the short term.
Momentum Analysis:
- RSI: The Relative Strength Index (RSI) has been hovering around the oversold territory, indicating a potential reversal or consolidation phase.
- Stochastic Oscillator: Both %K and %D have been rising, showing a bullish momentum building up.
- Williams %R: The Williams %R is also in the oversold region, signaling a possible reversal in the stock price.
Volatility Analysis:
- Bollinger Bands (BB): The Bollinger Bands have been narrowing, suggesting a decrease in volatility and a potential breakout in the near future.
- BB% (BB Percentage): The BB% has been fluctuating, indicating uncertainty in price direction.
Volume Analysis:
- On-Balance Volume (OBV): The OBV has been declining, reflecting selling pressure in the stock.
- Chaikin Money Flow (CMF): The CMF has been negative, indicating outflow of money from the stock.
Key Observations:
- The trend indicators point towards a short-term bearish outlook.
- Momentum indicators show conflicting signals with RSI in oversold territory but Stochastic and Williams %R hinting at a potential reversal.
- Volatility indicators suggest a potential breakout due to narrowing Bollinger Bands.
- Volume indicators reflect selling pressure and negative money flow.
Conclusion:
Based on the analysis of the technical indicators, the stock price of AACG is likely to experience further downward movement in the short term. The bearish trend indicated by moving averages and MACD, coupled with negative OBV and CMF, suggests a continuation of the current downtrend. Traders should exercise caution and consider shorting or staying on the sidelines until a clearer bullish signal emerges.