Technical Analysis of WRN 2024-05-10
Overview:
In analyzing the technical indicators for WRN over the last 5 days, we will delve into the trend, momentum, volatility, and volume indicators to provide a comprehensive outlook on the possible stock price movement. By examining these key aspects, we aim to offer valuable insights and predictions for the upcoming days.
Trend Analysis:
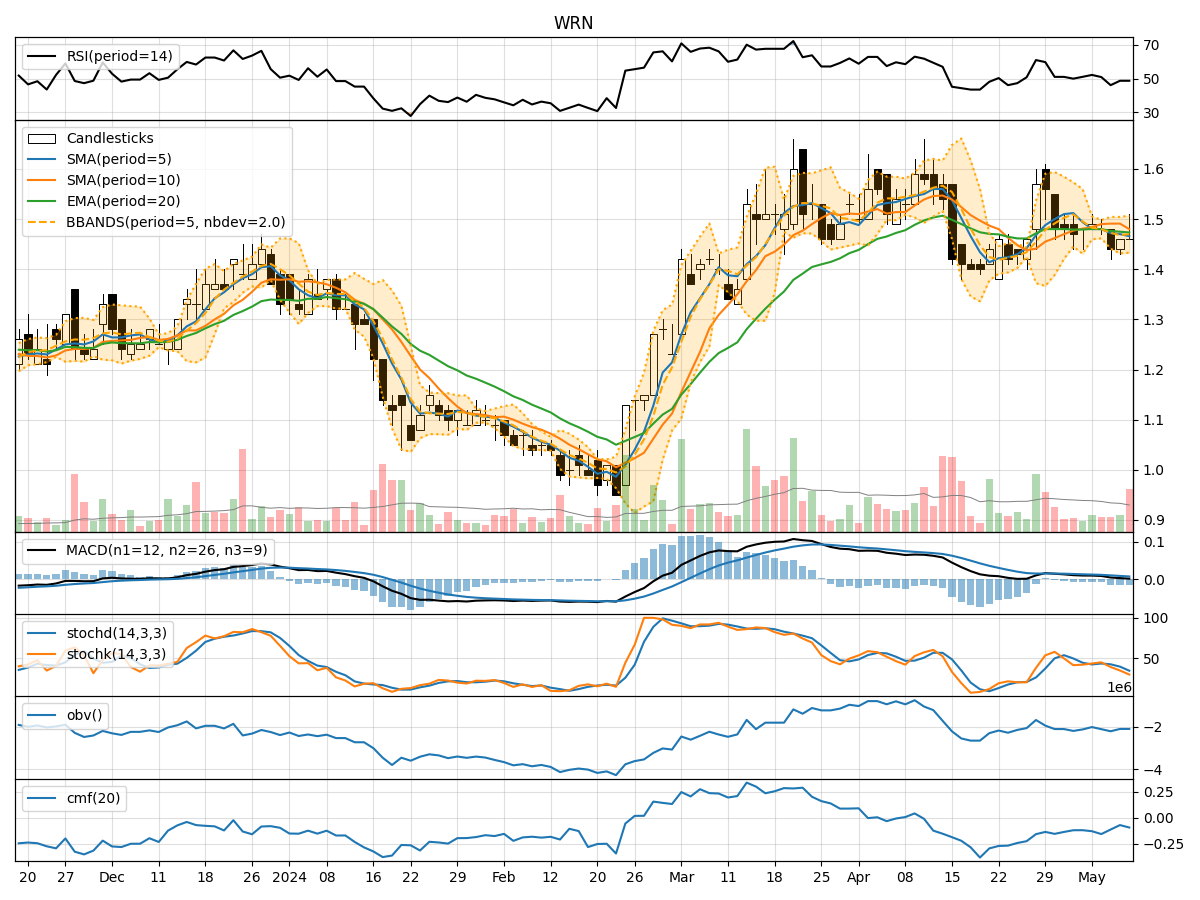
- Moving Averages (MA): The 5-day Moving Average (MA) has been relatively stable around the 1.47-1.48 range, indicating a neutral trend.
- MACD: The Moving Average Convergence Divergence (MACD) has shown a slight positive trend, with the MACD line consistently above the signal line.
Key Observation: The trend indicators suggest a neutral to slightly positive trend in the stock price.
Momentum Analysis:
- RSI: The Relative Strength Index (RSI) has hovered around the mid-40s, indicating neither overbought nor oversold conditions.
- Stochastic Oscillator: Both %K and %D have been declining, suggesting a weakening momentum.
Key Observation: Momentum indicators reflect a neutral to slightly bearish sentiment in the stock.
Volatility Analysis:
- Bollinger Bands (BB): The Bollinger Bands have shown narrowing volatility, with the stock price trading within the bands.
Key Observation: Volatility has decreased, indicating a potential period of consolidation or a forthcoming breakout.
Volume Analysis:
- On-Balance Volume (OBV): The OBV has been relatively stable, indicating no significant divergence between price and volume.
- Chaikin Money Flow (CMF): The CMF has been negative, suggesting selling pressure in the stock.
Key Observation: Volume indicators point towards a lack of strong buying interest and potential selling pressure.
Conclusion:
Based on the analysis of the technical indicators, the next few days' possible stock price movement for WRN is sideways consolidation with a slight bearish bias. The trend indicators suggest a neutral to slightly positive outlook, while momentum indicators indicate a neutral to slightly bearish sentiment. Volatility has decreased, signaling a potential consolidation phase, and volume indicators point towards a lack of strong buying interest.
Key Conclusion: The stock is likely to trade within a narrow range in the upcoming days, with a possibility of a slight downward bias. Traders should exercise caution and monitor key support and resistance levels for potential breakout opportunities.