Technical Analysis of TMQ 2024-05-10
Overview:
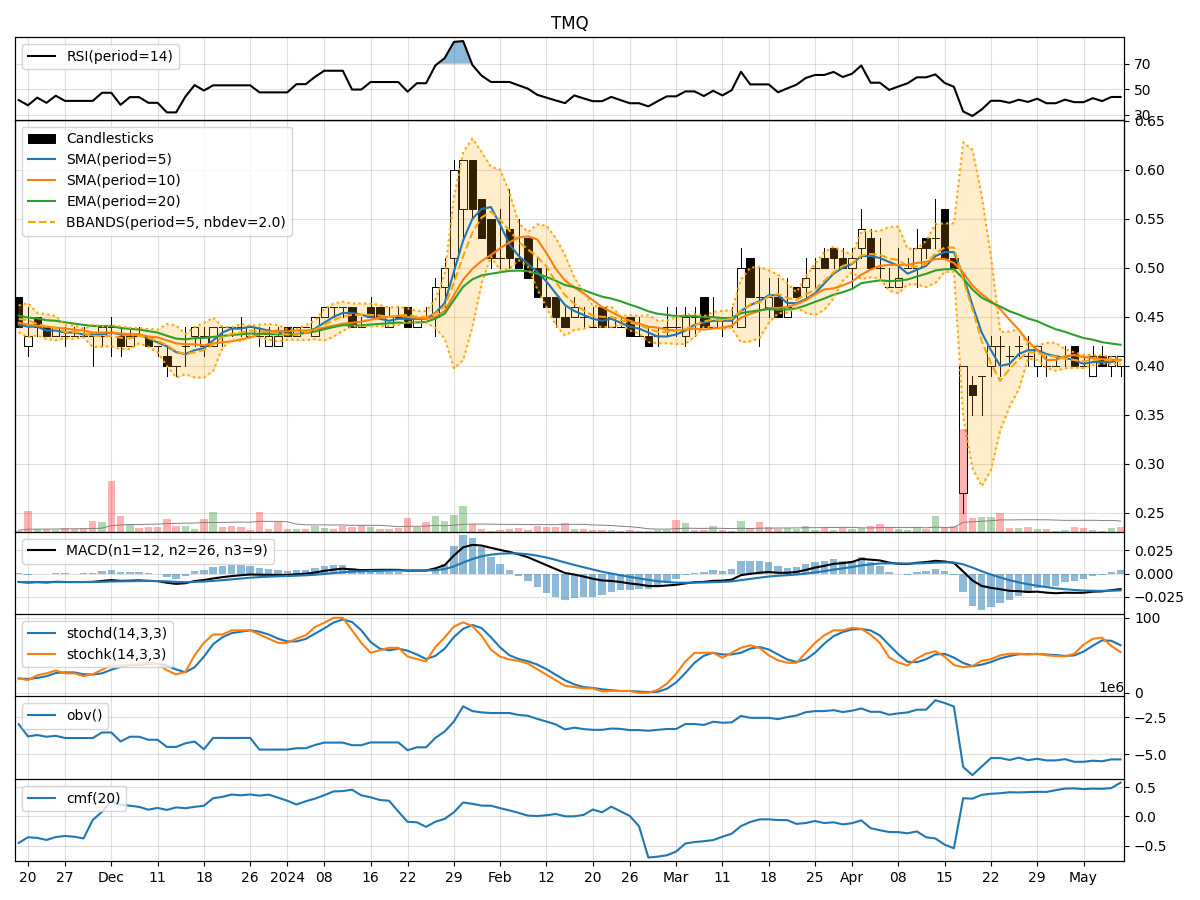
In analyzing the technical indicators for TMQ over the last 5 days, we will delve into the trend, momentum, volatility, and volume indicators to provide a comprehensive outlook on the possible stock price movement in the coming days. By examining these key aspects, we aim to offer valuable insights and predictions for potential investors.
Trend Analysis:
- Moving Averages (MA): The 5-day MA has been relatively stable around 0.404, indicating a neutral trend.
- MACD and Signal Line: The MACD has been consistently negative, suggesting a bearish trend.
- Relative Strength Index (RSI): The RSI has been fluctuating around 40-44, indicating a neutral sentiment.
Key Observation: The trend indicators point towards a slightly bearish sentiment in the short term.
Momentum Analysis:
- Stochastic Oscillator: The Stochastic Oscillator has been declining, indicating a bearish momentum.
- Williams %R (WillR): The WillR has been consistently in the oversold territory, suggesting a bearish sentiment.
Key Observation: Momentum indicators align with the bearish trend, indicating potential downward pressure on the stock price.
Volatility Analysis:
- Bollinger Bands (BB): The stock price has been trading within the bands, with the upper band acting as resistance.
- Bollinger %B (BBP): The %B has been fluctuating, indicating moderate volatility.
Key Observation: Volatility remains moderate, with the upper Bollinger Band acting as a resistance level.
Volume Analysis:
- On-Balance Volume (OBV): The OBV has been fluctuating, indicating indecision among investors.
- Chaikin Money Flow (CMF): The CMF has been positive, suggesting some buying pressure.
Key Observation: Volume indicators show mixed signals, with no clear direction in investor sentiment.
Conclusion:
Based on the analysis of trend, momentum, volatility, and volume indicators, the overall outlook for TMQ in the next few days is bearish. The bearish trend and momentum indicators, coupled with moderate volatility and mixed volume signals, suggest a potential downward movement in the stock price. Investors should exercise caution and consider waiting for more definitive signals before making any trading decisions.
Key Conclusion:
The technical analysis indicates a downward trend for TMQ in the coming days, with a bearish sentiment prevailing across multiple indicators. Investors should closely monitor the price action and key support levels to assess the potential for a reversal in the trend.