Technical Analysis of SLSR 2024-05-10
Overview:
In analyzing the technical indicators for SLSR over the last 5 days, we will delve into the trend, momentum, volatility, and volume indicators to provide a comprehensive outlook on the possible stock price movement. By examining these key aspects, we aim to offer valuable insights and predictions for the upcoming days.
Trend Analysis:
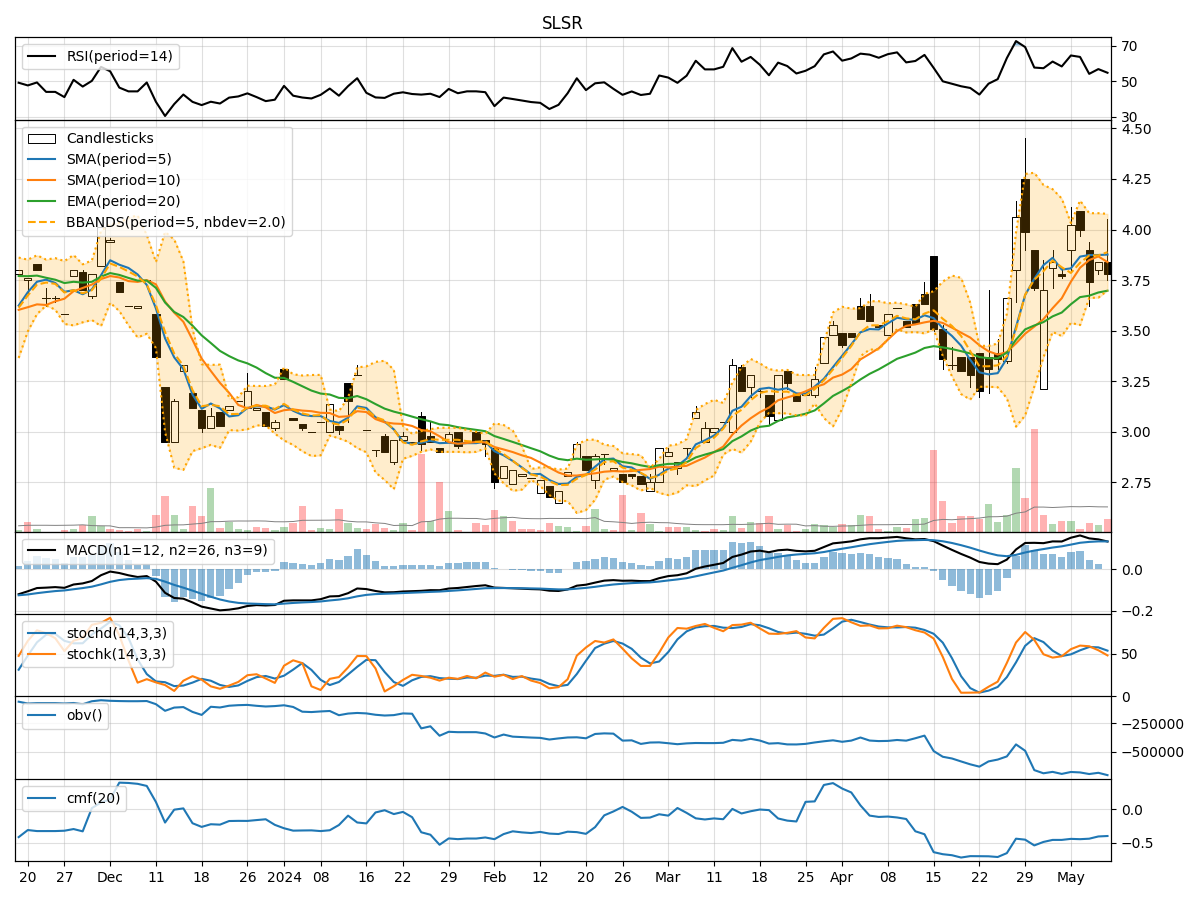
- Moving Averages (MA): The 5-day Moving Average (MA) has been fluctuating around the closing prices, indicating short-term price trends. The Simple Moving Average (SMA) and Exponential Moving Average (EMA) show a gradual increase over the period.
- MACD: The Moving Average Convergence Divergence (MACD) and its signal line (MACDh) have been positive, suggesting a bullish momentum in the stock price.
Momentum Analysis:
- RSI: The Relative Strength Index (RSI) has been oscillating around the mid-level, indicating a balanced momentum between buying and selling pressure.
- Stochastic Oscillator: Both %K and %D have been fluctuating, showing indecision in the momentum of the stock.
- Williams %R: The Williams %R is in the oversold region, suggesting a potential reversal in the stock price.
Volatility Analysis:
- Bollinger Bands (BB): The Bollinger Bands have been narrowing, indicating decreasing volatility in the stock price.
- Bollinger %B: The %B indicator has been hovering around the mid-level, signifying a neutral stance in volatility.
Volume Analysis:
- On-Balance Volume (OBV): The OBV has been declining, indicating a decrease in buying pressure over the last few days.
- Chaikin Money Flow (CMF): The CMF has been negative, suggesting outflow of money from the stock.
Key Observations:
- The trend indicators show a positive bias with increasing moving averages and a bullish MACD.
- Momentum indicators reflect a mixed sentiment with RSI around the neutral zone and stochastic oscillating.
- Volatility has been decreasing as per the Bollinger Bands, indicating a potential consolidation phase.
- Volume indicators suggest a decrease in buying pressure and negative money flow.
Conclusion:
Based on the analysis of the technical indicators, the stock of SLSR is likely to experience sideways movement in the upcoming days. The decreasing volatility and mixed momentum signal a period of consolidation, while the declining OBV and negative CMF indicate a lack of strong buying interest. Traders may expect the stock price to trade within a range with no clear directional bias. It is advisable to closely monitor the key support and resistance levels for potential breakout opportunities.