Technical Analysis of SLI 2024-05-10
Overview:
In analyzing the technical indicators for SLI over the last 5 days, we will delve into the trend, momentum, volatility, and volume indicators to provide a comprehensive outlook on the possible stock price movement. By examining these key aspects, we aim to offer valuable insights and predictions for the upcoming days.
Trend Analysis:
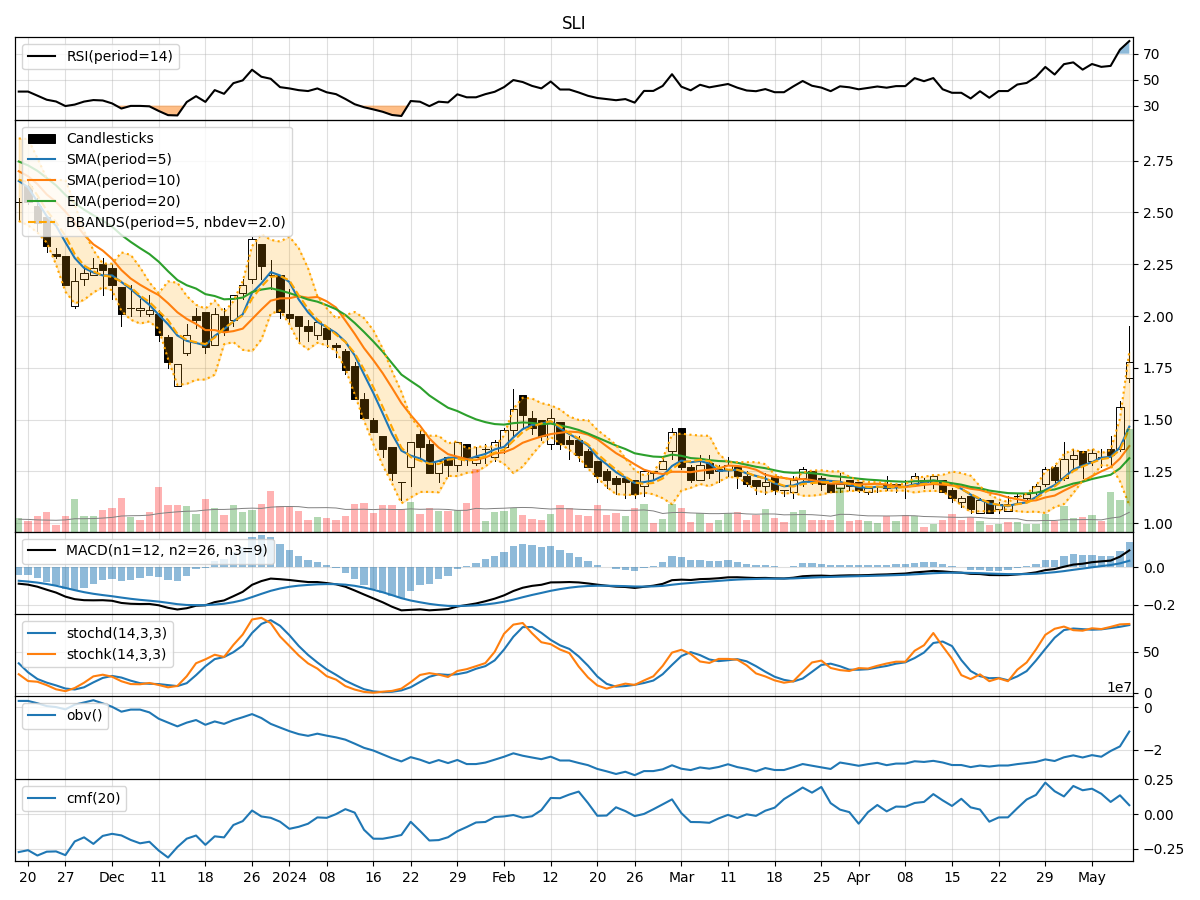
- Moving Averages (MA): The 5-day Moving Average (MA) has been consistently increasing, indicating a bullish trend in the short term.
- MACD: The Moving Average Convergence Divergence (MACD) has shown positive values, suggesting upward momentum in the stock price.
Momentum Analysis:
- RSI: The Relative Strength Index (RSI) has been trending upwards, reaching overbought levels on the last trading day, indicating strong bullish momentum.
- Stochastic Oscillator: Both %K and %D values have been relatively high, signaling strong buying pressure.
Volatility Analysis:
- Bollinger Bands (BB): The Bollinger Bands have widened, indicating increased volatility in the stock price.
Volume Analysis:
- On-Balance Volume (OBV): The OBV has been steadily increasing, reflecting strong buying interest in the stock.
- Chaikin Money Flow (CMF): The CMF has shown positive values, suggesting that money is flowing into the stock.
Key Observations:
- The stock has been on an upward trend, supported by positive momentum and increasing buying pressure.
- Volatility has also increased, potentially leading to larger price swings in the coming days.
- The volume indicators indicate strong accumulation of the stock by investors.
Conclusion:
Based on the analysis of the technical indicators, the stock is likely to continue its upward trajectory in the next few days. The bullish trend, positive momentum, increasing buying pressure, and strong accumulation suggest that the stock price is poised for further gains. Traders and investors may consider buying opportunities in SLI, as the technical indicators point towards a bullish outlook for the stock.