Technical Analysis of SILV 2024-05-10
Overview:
In analyzing the technical indicators for SILV over the last 5 days, we will delve into the trend, momentum, volatility, and volume indicators to provide a comprehensive assessment of the stock's potential price movement. By examining these key factors, we aim to offer valuable insights and predictions for the next few days.
Trend Analysis:
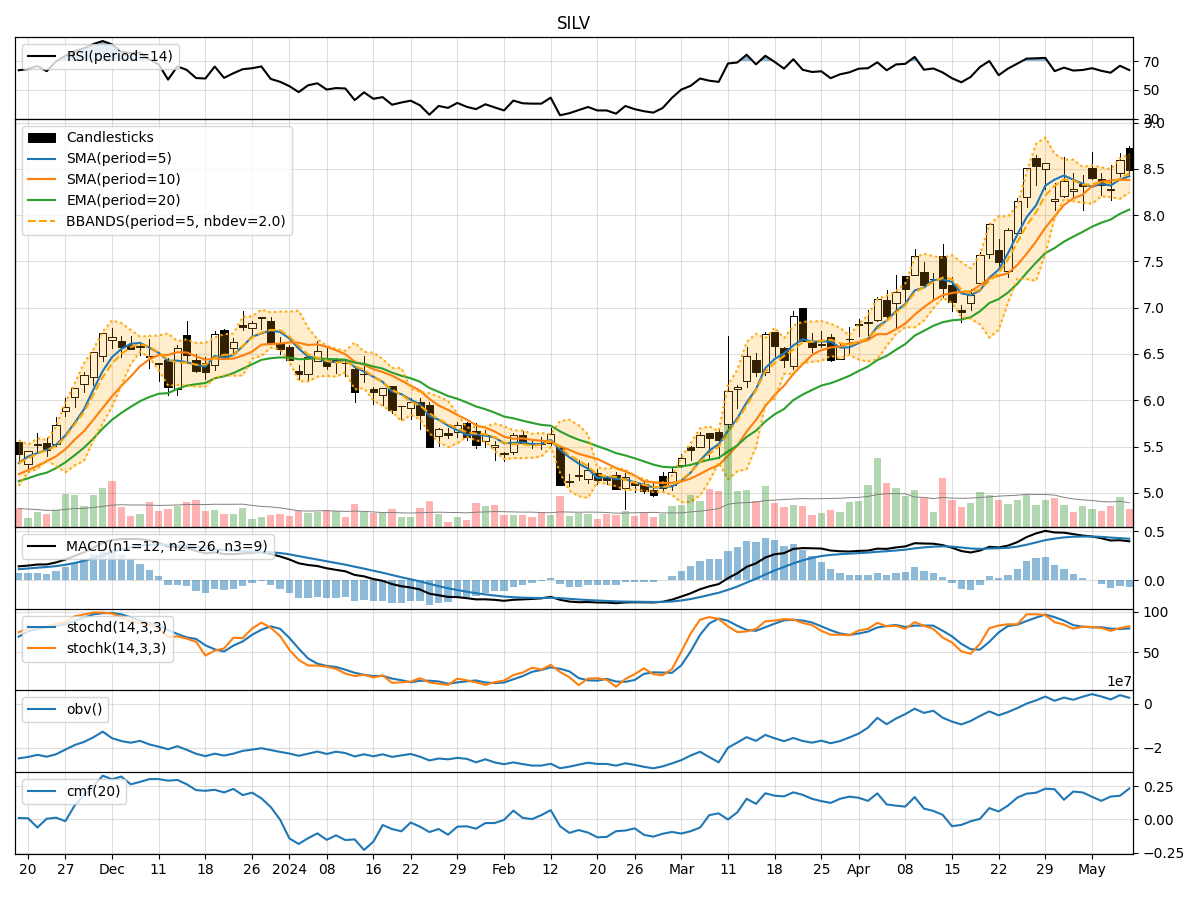
- Moving Averages (MA): The 5-day MA has been fluctuating around the closing prices, indicating a relatively stable trend.
- MACD: The MACD line has been consistently positive, albeit with a slight decrease in recent days.
- EMA: The EMA has been on an upward trajectory, suggesting a bullish trend.
Key Observation: The trend indicators point towards a bullish sentiment in the short term.
Momentum Analysis:
- RSI: The RSI values have been fluctuating around the overbought territory, indicating strong buying momentum.
- Stochastic Oscillator: Both %K and %D have been in the overbought zone, suggesting a potential reversal.
- Williams %R: The indicator has been hovering in the oversold region, signaling a possible buying opportunity.
Key Observation: Momentum indicators suggest a mixed sentiment with a potential for a reversal in the near future.
Volatility Analysis:
- Bollinger Bands: The stock price has been trading within the bands, indicating moderate volatility.
- Bollinger %B: The %B values have been fluctuating around the midline, suggesting a balanced market sentiment.
Key Observation: Volatility indicators point towards a sideways movement with no clear trend.
Volume Analysis:
- On-Balance Volume (OBV): The OBV values have been fluctuating, indicating indecision among investors.
- Chaikin Money Flow (CMF): The CMF values have been positive, suggesting buying pressure.
Key Observation: Volume indicators reflect a neutral sentiment with a slight bullish bias.
Conclusion:
Based on the analysis of trend, momentum, volatility, and volume indicators, the next few days for SILV are likely to see a bullish trend continuation in the short term. However, the momentum indicators suggest a potential for a reversal in the near future, so traders should exercise caution. The volatility indicators point towards a sideways movement, while volume indicators indicate a neutral sentiment with a slight bullish bias.
Overall, the stock is expected to experience a short-term bullish trend with the possibility of a reversal, presenting opportunities for both long and short-term traders.