Technical Analysis of SER 2024-05-31
Overview:
In analyzing the technical indicators for SER stock over the last 5 days, we will delve into the trend, momentum, volatility, and volume indicators to provide a comprehensive outlook on the possible stock price movement in the coming days. By examining these key indicators, we aim to offer valuable insights and predictions for potential investors.
Trend Analysis:
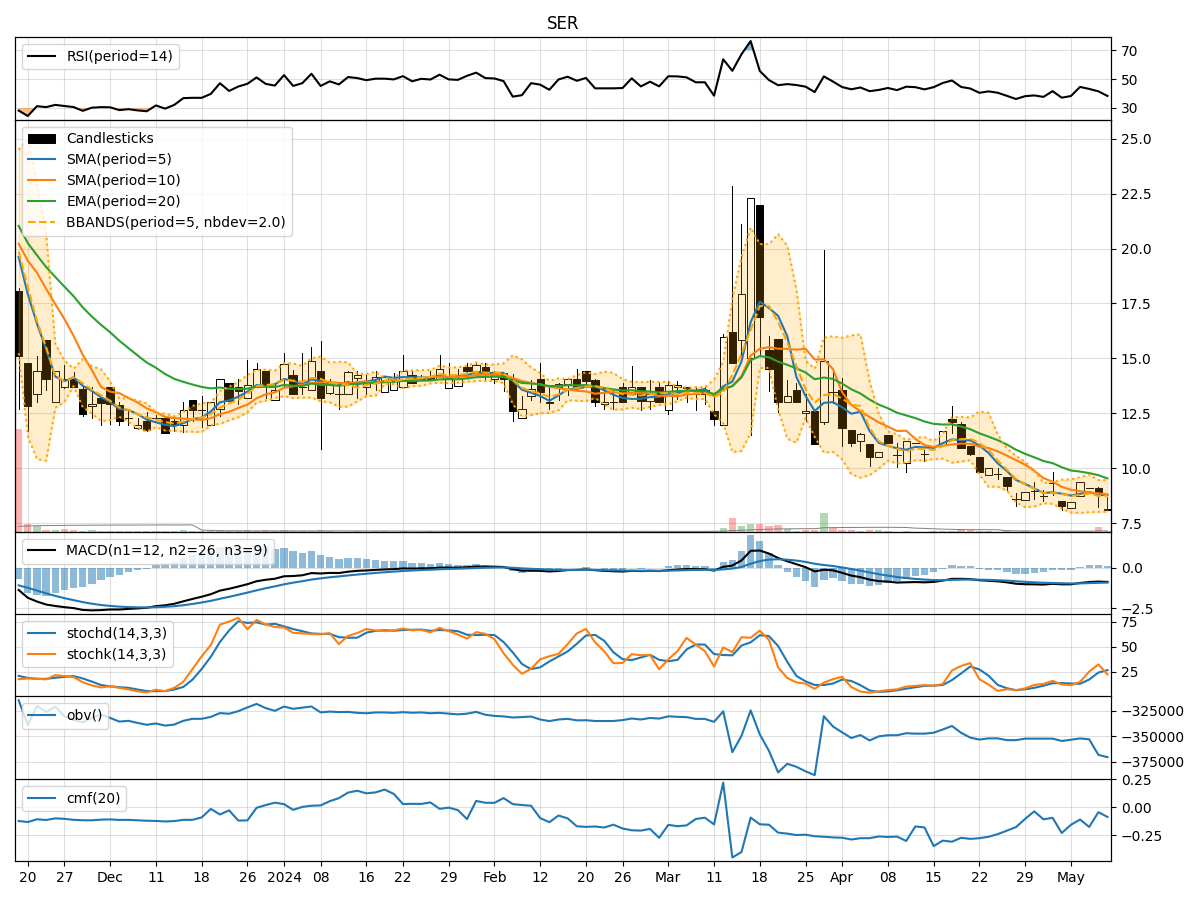
- Moving Averages (MA): The 5-day Moving Average (MA) has been fluctuating around the closing prices, indicating short-term price trends. The Simple Moving Average (SMA) and Exponential Moving Average (EMA) show a slight upward trend, suggesting a potential bullish sentiment.
- MACD: The Moving Average Convergence Divergence (MACD) has been negative but narrowing, indicating a possible reversal in the bearish momentum. The MACD Histogram (MACDH) is positive, signaling a potential shift towards bullish momentum.
Momentum Analysis:
- RSI: The Relative Strength Index (RSI) has been hovering around the neutral zone, indicating a balanced market sentiment with no extreme overbought or oversold conditions.
- Stochastic Oscillator: Both %K and %D lines of the Stochastic Oscillator are in the oversold territory, suggesting a potential buying opportunity. However, the momentum is weak, indicating caution.
Volatility Analysis:
- Bollinger Bands (BB): The Bollinger Bands are narrowing, indicating decreasing volatility and a potential price breakout in the near future. The bands are squeezing, suggesting a period of consolidation before a potential significant price movement.
- Bollinger %B: The %B indicator is below 0.5, indicating that the stock price is trading below the lower Bollinger Band, signaling a possible oversold condition.
Volume Analysis:
- On-Balance Volume (OBV): The OBV indicator has been relatively flat, suggesting a balance between buying and selling pressure. This indicates a lack of strong conviction from market participants.
- Chaikin Money Flow (CMF): The CMF is negative, indicating that money is flowing out of the stock. This suggests a bearish sentiment in terms of volume flow.
Conclusion:
Based on the analysis of the technical indicators, the stock price of SER is likely to experience sideways movement in the next few days. The trend indicators show a potential bullish sentiment, supported by the narrowing MACD and positive MACD Histogram. However, the momentum indicators suggest a weak buying momentum, and the volatility indicators point towards a period of consolidation before a potential breakout. The volume indicators also indicate a lack of strong conviction from market participants, further supporting the sideways movement hypothesis.
Recommendation:
- Short-term Traders: Consider waiting for a clearer signal before entering a position, as the stock is likely to consolidate in the near term.
- Long-term Investors: Monitor the price action closely for a potential breakout above the upper Bollinger Band as a signal to enter or add to positions.
Always remember to conduct further research and consider other fundamental factors before making any investment decisions.