Technical Analysis of RYDE 2024-05-10
Overview:
In analyzing the technical indicators for RYDE over the last 5 days, we will delve into the trend, momentum, volatility, and volume indicators to provide a comprehensive outlook on the possible stock price movement in the coming days. By examining these key indicators, we aim to offer valuable insights and predictions to guide investment decisions.
Trend Indicators:
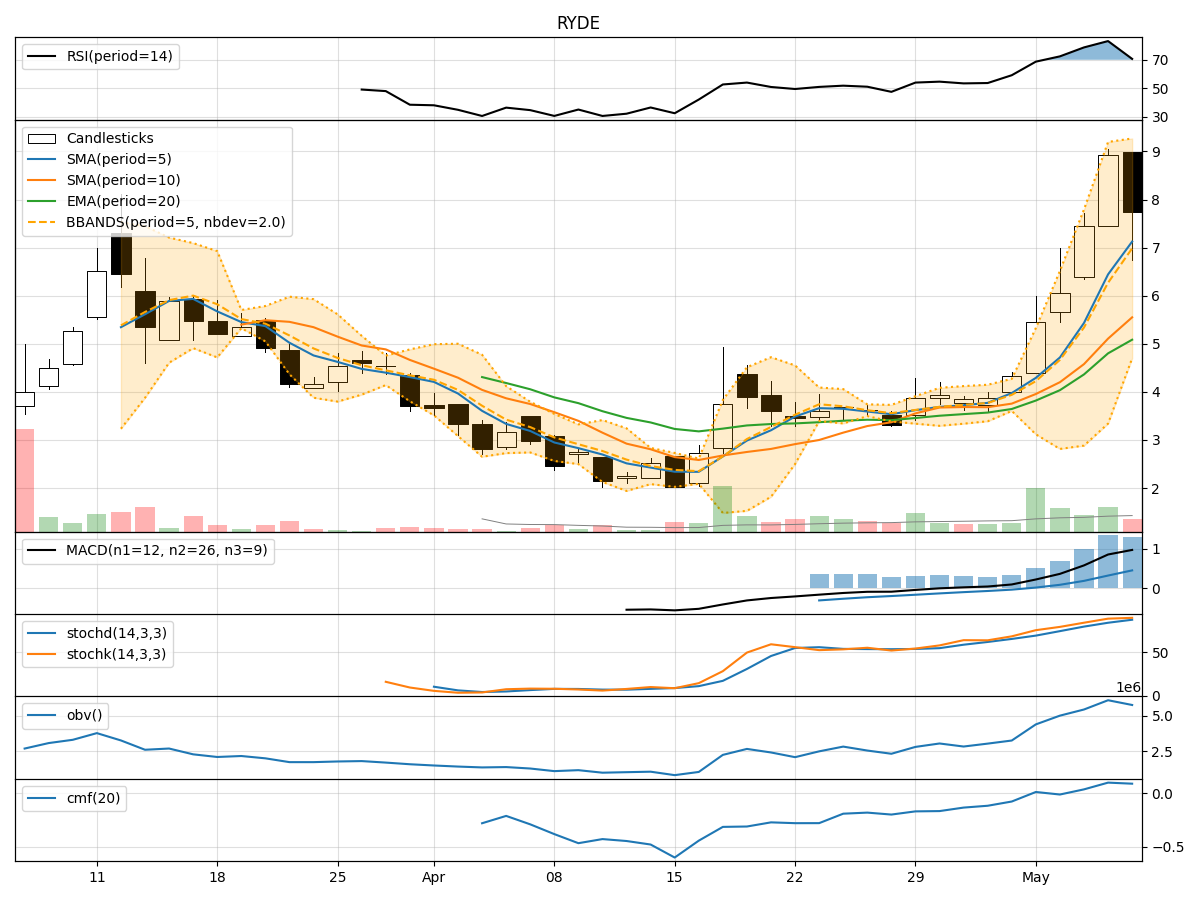
- Moving Averages (MA): The 5-day moving average has been consistently increasing, indicating a bullish trend in the short term.
- MACD: The MACD line has been positive and rising, suggesting bullish momentum.
- RSI: The RSI values have been relatively high, indicating overbought conditions but also strong bullish momentum.
Key Observation: The trend indicators point towards a strong bullish sentiment in the stock.
Momentum Indicators:
- Stochastic Oscillator: Both %K and %D values have been in the overbought territory, signaling a potential reversal or consolidation.
- Williams %R: The Williams %R is in the oversold region, indicating a potential buying opportunity.
Key Observation: Momentum indicators suggest a possible short-term correction or consolidation.
Volatility Indicators:
- Bollinger Bands: The stock price has been trading above the upper Bollinger Band, indicating overbought conditions.
- Bollinger %B: The %B value is above 0.8, suggesting a potential reversal or pullback.
Key Observation: Volatility indicators signal a potential reversal or correction in the stock price.
Volume Indicators:
- On-Balance Volume (OBV): The OBV has been increasing, indicating accumulation by investors.
- Chaikin Money Flow (CMF): The CMF is positive, suggesting buying pressure in the stock.
Key Observation: Volume indicators support the bullish sentiment in the stock.
Conclusion:
Based on the analysis of the technical indicators, the stock of RYDE is currently exhibiting strong bullish momentum in the short term. However, the overbought conditions indicated by the momentum and volatility indicators suggest a potential correction or consolidation in the coming days. Investors should exercise caution and consider taking profits or implementing risk management strategies.
Overall Assessment: The stock is likely to experience a short-term correction or consolidation before potentially resuming its upward trend. Traders may consider booking profits or waiting for a better entry point, while long-term investors can hold their positions with a watchful eye on the market dynamics.