Technical Analysis of PHGE 2024-05-10
Overview:
In analyzing the technical indicators for PHGE over the last 5 days, we will delve into the trend, momentum, volatility, and volume indicators to provide a comprehensive outlook on the possible stock price movement in the coming days. By examining these key aspects, we aim to offer valuable insights and predictions to guide your investment decisions.
Trend Analysis:
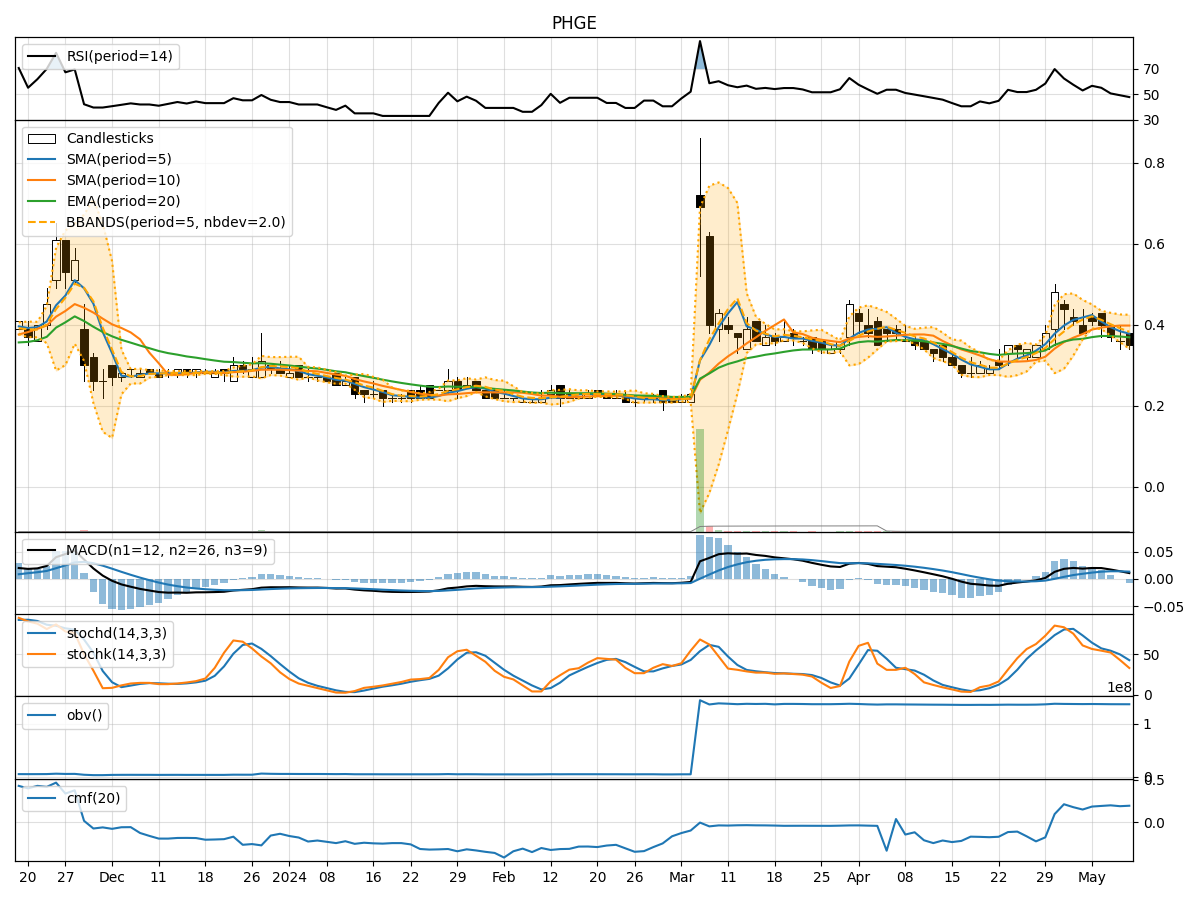
- Moving Averages (MA): The 5-day MA has been consistently below the closing price, indicating a short-term bearish trend.
- MACD: The MACD line has been decreasing, with the MACD histogram also showing a downward trend, suggesting weakening momentum.
Momentum Analysis:
- RSI: The RSI has been declining, indicating a loss of bullish momentum.
- Stochastic Oscillator: Both %K and %D have been decreasing, signaling a potential shift towards oversold conditions.
Volatility Analysis:
- Bollinger Bands (BB): The stock price has been trading below the middle Bollinger Band, indicating a bearish sentiment.
Volume Analysis:
- On-Balance Volume (OBV): The OBV has been relatively stable, suggesting a neutral volume flow.
- Chaikin Money Flow (CMF): The CMF has been fluctuating around the zero line, indicating a balance between buying and selling pressure.
Key Observations:
- The stock is currently in a downtrend based on moving averages and MACD analysis.
- Momentum indicators like RSI and Stochastic Oscillator suggest a weakening bullish momentum.
- Volatility indicators point towards a bearish sentiment with the stock trading below the middle Bollinger Band.
- Volume indicators show a neutral volume flow with a balance between buying and selling pressure.
Conclusion:
Based on the analysis of the technical indicators, the next few days for PHGE are likely to see a continuation of the downward trend with weakening bullish momentum and bearish sentiment prevailing in the market. Traders and investors should exercise caution and consider potential short-term selling opportunities or wait for a clearer signal of a trend reversal before considering long positions.