Technical Analysis of OZ 2024-05-31
Overview:
In analyzing the technical indicators for OZ stock over the last 5 days, we will delve into the trend, momentum, volatility, and volume indicators to provide a comprehensive outlook on the possible stock price movement in the coming days. By examining these key indicators, we aim to offer valuable insights and predictions to guide investment decisions.
Trend Indicators:
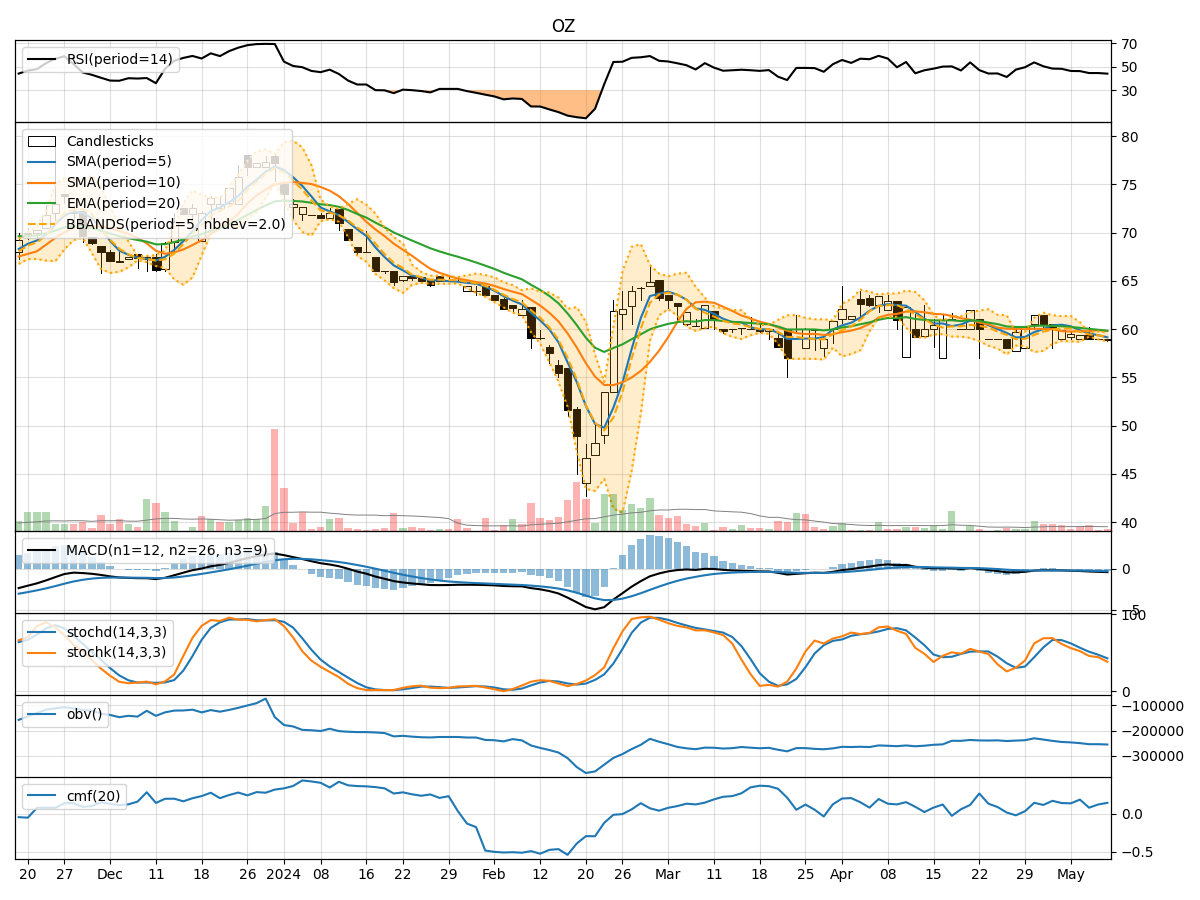
- Moving Averages (MA): The 5-day MA has been fluctuating around the closing prices, indicating a lack of clear trend direction.
- MACD: The MACD line has been consistently below the signal line, suggesting a bearish momentum in the short term.
- EMA: The EMA has been gradually declining, reflecting a downward trend in the stock price.
Momentum Indicators:
- RSI: The RSI has been hovering around the neutral zone, indicating a lack of strong buying or selling pressure.
- Stochastic Oscillator: Both %K and %D have been declining, signaling a potential bearish momentum.
- Williams %R: The indicator has been fluctuating in the oversold territory, suggesting a possible reversal in the stock price.
Volatility Indicators:
- Bollinger Bands: The bands have been narrowing, indicating decreasing volatility in the stock price.
- Bollinger %B: The %B has been relatively stable, suggesting a lack of significant price movements.
- Bollinger Band Width: The band width has been contracting, signaling a period of consolidation.
Volume Indicators:
- On-Balance Volume (OBV): The OBV has been fluctuating, indicating mixed buying and selling pressure.
- Chaikin Money Flow (CMF): The CMF has been declining, suggesting a decrease in buying pressure over the 20-day period.
Conclusion:
Based on the analysis of the technical indicators, the stock is likely to experience sideways movement in the coming days. The lack of clear trend direction, coupled with bearish signals from the MACD and stochastic oscillator, indicates a potential for consolidation or range-bound trading. The decreasing volatility and mixed volume signals further support this view.
Recommendation: It is advisable to closely monitor the stock for any breakout or reversal signals before making any trading decisions. Consider setting tight stop-loss levels to manage risk effectively in the current market environment.